Search interesting materials

Monday, May 29, 2017

Interesting readings

The task of MOF by Ajay Shah in Business Standard, May 28, 2017.

India Second Most Complex Tax Jurisdiction After China, Deloitte Says by PTI in Bloomberg, May 28, 2017.

Three Years of Modi Management: The Numbers Don't Tell a Good Story by M. K. Venu in The Wire, May 27, 2017.

A bleak outlook - The road to mob rule in Uttar Pradesh by Ramachandra Guha in The Telegraph, May 27, 2017.

Modi Government's New Restrictions on 'Cattle' Slaughter Will Hurt Indian Farmers the Most by Sagari R. Ramdas in The Wire, May 27, 2017.

Rise of war porn: The hyper-nationalism being unleashed today has electoral rather than strategic considerations by Manoj Joshi in The Times of India, May 27, 2017.

Why the BJP must fear its own fringe by Abhijit V. Banerjee in The Indian Express, May 26, 2017.

If Creating Institutions of Eminence is to be More Than a Naming Exercise, Here Are a Few Ideas by Gautam Desiraju in Swarajya, May 25, 2017.

Publishers fear red tape, censorship, Govt gets a warning by Ritika Chopra in The Indian Express, May 25, 2017.

Why religion and building temples is a profitable business in India by
Mohan Guruswamy in Hindustan Times, May 25, 2017.

Farm policy: Dis-ease of doing the business of agriculture by Pravesh Sharma in The Indian Express, May 25, 2017.

Donald Trump' Base Is Shrinking by Nate Silver in FiveThirtyEight, May 24, 2017.

There is no one right way to react to terror. There is a wrong way by Anne Applebaum in The Washington Post, May 24, 2017.

Trump's budget is simply ludicrous by Lawrence H. Summers in The Washington Post, May 23, 2017.

Google's AI Invents Sounds Humans Have Never Heard Before by Cade Metz in Wired, May 15, 2017.

It took a century to create the weekend - and only a decade to undo it by Katrina Onstad in Quartz, May 6, 2017.

Saturday, May 27, 2017

Improved measurement of Exchange Market Pressure (EMP)

by Ila Patnaik, Josh Felman, Ajay Shah.

Exchange rates vs. exchange market pressure


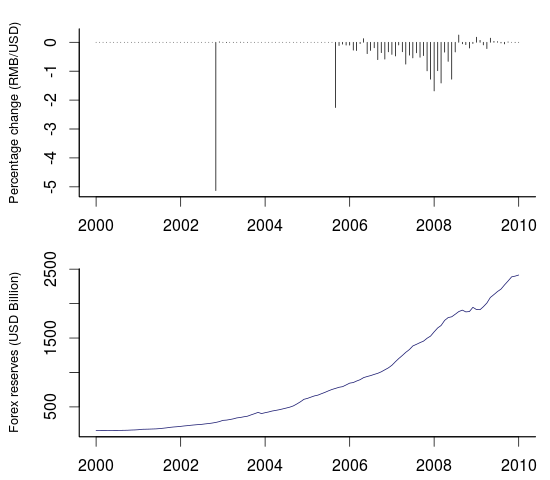
Changes in the exchange rate are very visible. But is the apparent change in the exchange rate a fair depiction of the pressure on the currency market? As an example, consider China's story with the exchange rate:

Figure 1: China's monthly exchange rate returns (upper) and foreign exchange reserves (lower)

The upper panel is monthly returns on the CNY/USD. Positive returns are depreciations and vice versa.  We see large periods of zero change separated by a few months in which there was an appreciation. Does this mean that in the long periods of zero change in the exchange rate, the currency market was quiescent? No. This is a period in which the Chinese central bank was trading in the currency market on a large scale. As the graph of their foreign exchange reserves shows, they went from \$0.4T in 2004 to \$1.9T in 2009. There was a lot of pressure on the currency to appreciate. What we see, as zero or small negative returns, understates the true story.

In order to address this problem, economists aspire to construct a measure of `exchange market pressure' (EMP), which would show the true conditions on the currency market in each month. To borrow a phrase from Amit Varma's podcast, there's an important difference here between the seen and the unseen. The apparent exchange rate change is what we see. What's really going on, in terms of the macroeconomic situation on the currency market, is the exchange rate pressure.

Conventional thinking in EMP measurement


Attempts at EMP measurement have been in progress since Girton and Roper, 1977. There are many EMP measures in the literature. An important one, which expresses the mainstream strategy, is by Eichengreen et. al., 1996 . They propose an EMP index for a country is given by:

\[
\textrm{EMP}_{t} = \frac{1}{\sigma_{e}} \frac{\Delta e_{t}}{e_{t}} - \frac{1}{\sigma_{\bar r}} \left ( \frac{\Delta \bar r_{t}}{\bar r_{t}} - \frac{\Delta \bar r_{US_t}}{\bar r_{US_t}} \right) + \frac{1}{\sigma_i} \left (\Delta \left (i_{t} - i_{US_t} \right) \right)
\]

Where the exchange rate is denoted by $e_t$, reserves divided by base money is $\bar r_t$ and intervention of the central bank at time $t$ is $i_t$. The change in $e_t$ is denoted by $\Delta e_t$; the change in $\frac{r_t}{m_0}$ is denoted by $\Delta \bar r_t$. The three sigmas, $\sigma_e$, $\sigma_{\bar r_t}$, and $\sigma_i$, denote the standard deviations of the relative change in the exchange rate, difference between relative changes in the ratio of foreign reserves and base money in the home country against the reference country (US), and the nominal interest rate differential.

This EMP measure is essentially a weighted average of changes in exchange rate, foreign exchange reserves, and interest rates. To prevent the most volatile component of the index from dominating (usually the forex reserves), each component is weighted by its standard deviations. The resulting EMP index is dimensionless. There is a literature (Pentecost et. al., 2001, IMF.,2007) which finds that these kinds of measures are useful in forecasting currency crises.

Problems with conventional EMP measurement


This approach to measurement has several problems. When there is a fixed exchange rate, the standard deviation in the denominator goes to zero. When a country with an inflexible rate (low $\sigma_e$) experiences a modest change in the exchange rate, this shows up as a large value of EMP. As an example, consider the Chinese experience in the time period covered in Figure 1:

Figure 2: Conventional EMP measure for China

In some months, it is not possible to compute the EMP as we get a divide by zero. In other months also, the graph above does not square with our understanding of what was going on. As an example, consider the period after the Lehman collapse. The EMP measure seems to suggest that this is where the highest pressure to appreciate was seen, which seems incorrect.

A better EMP measure


A recent paper, Patnaik et al., 2017 introduces a new method for measurement of EMP. This new approach seeks to measure EMP in the units of percentage change of the exchange rate of the month. The EMP reported for a month is an estimate of the unseen - the exchange rate change (measured in per cent) which would have taken place if there had been no currency intervention in that month.

Let's treat this new method as a black box and examine how well it works.

Example: EMP in China


Figure 3: Conventional vs. new EMP measures for China

The figure above juxtaposes the conventional EMP measure against the new proposed measure.

There are two gray blocks in the conventional measure, where EMP can't be computed as it was a fixed exchange rate and we encounter the divide by zero. The new measure has no such problem.

In the long period of pressure to appreciate, the new measure shows an interpretable value such as a 5% appreciation in the month, which would have taken place if there had been no trading by the central bank in the currency market. The conventional EMP index is dimensionless and cannot be interpreted in similar fashion.

At the Lehman crisis, the new measure shows a sudden shift in exchange market pressure, followed by a return to the pressure to appreciate. The conventional measure suggests the highest ever pressure to appreciate was found at the time of the Lehman crisis, and this pressure subsided later.

Example: EMP in India


Figure 4: Conventional vs. new EMP measures for India

For macroeconomists who know the Indian experience closely, the new measure makes a lot of sense.

In early 2007, it is rumoured that RBI was purchasing as much as \$1B a day, and there was very high pressure to appreciate prior to the structural break in the exchange rate regime on 23 March 2007. This shows up correctly in the new measure. The conventional measure, in contrast, thinks there was not much going on then.

The conventional measure seems to say that at the Lehman crisis, there was a switch from depreciation pressure to appreciation pressure. This seems unlikely. The new measure shows the highest-ever pressure to depreciate right after the Lehman crisis. This seems correct.

Example: EMP in Russia


Figure 5: Conventional vs. new EMP measures for Russia

There was a long period (2002-2008) with one-way pressure to appreciate. This is picked up in the new measure but not in the conventional measure.

The Russian invasion of Georgia (08/08/08), followed by the Lehman shock in the next month, are associated with an immediate shift to depreciation pressure in the new measure (from August itself, reflecting the Georgia invasion). The conventional measure does not pick up these events correctly.

The Russian invasion of Crimia is followed by pressure to depreciate, in the new measure. This does not appear as clear in the conventional measure.

Example: EMP in Brazil


Figure 6: Conventional vs. new EMP measures for Brazil

The Lehman failure, and the Taper tantrum, show up as episodes of pressure to depreciate in the new measure but not in the conventional measure.

Conclusion


Exchange market pressure is an important tool for better understanding macroeconomics. While the concept has always been attractive, conventional methods for measurement have had limitations. The new measure makes it possible to take interest in EMP as a tool for macroeconomic analysis. This article aims to unveil the new measure as a black box, to show that it works better than the conventional measure. The methodology is presented in the underlying paper. The resulting dataset, with monthly EMP data for 139 countries, has been released, and has diverse potential research applications.

Bibliography


Eichengreen, B., Rose, A., Wyplosz, C., 1996. Contagious Currency Crises , Technical Report. National Bureau of Economic Research.

Patnaik, I., Felman, J. and Shah, A., 2017. An exchange market pressure measure for cross country analysis . Journal of International Money and Finance, 73, pp.62-77.

Desai, M., Patnaik, I., Felman, J. and Shah, A., 2017. A cross-country Exchange Market Pressure (EMP) Dataset . Data in Brief.

Pentecost, E., Van Hooydonk, C., Van Poeck, A., 2001. Measuring and estimating exchange market pressure in the EU . J. Int. Money Finan. 20, 401¡V418.

IMF, 2007. Managing Large Capital Inflows , Technical Report. International Monetary Fund.

Thursday, May 25, 2017

Regulatory Policy in India: Moving towards regulatory governance

by Lalita Som.

Regulatory policy, a comparatively young discipline, is evolving in different ways across the world, reflecting the diverse range of legal, political and cultural contexts on which countries have built their public governance. Regulation, one of the key levers of state power, is of critical importance in managing the economy, in sequencing business behaviour, implementing social policy and influencing behaviour. Regulatory policy thus helps to shape the relationship between the State, citizens and businesses.

In OECD countries, policies to increase competition in markets, and to "roll back the frontiers of the state" in the 1980s and 1990s, broadened to become regulatory reform. Regulatory reform became an essential adjunct to structural reforms, reaching out beyond the network sectors to encompass product market reforms and the liberalisation of professional services. Independent regulatory agencies were developed to manage key aspects of economies and society at an arm's length from the political process. This became known as the regulatory state. The regulatory state paved the way for the idea of regulatory governance (OECD, 2010a).

In OECD countries. regulatory policy has made a significant contribution to economic growth and societal well-being - through its contribution to structural reforms, liberalisation of product markets, international market openness, and a less-constricted business environment for innovation and entrepreneurship. Regulatory policy has supported the rule of law through initiatives to simplify the law and improve access to it, as well as improvements to appeal systems. Increasingly, it has supported quality of life and social cohesion, through enhanced transparency which seeks out the views of the regulated, and programmes to reduce red tape for citizens.

Many OECD countries are concerned about distributional equity – to maximise the welfare of the most disadvantaged, paying attention to distributional consequence of policy actions, albeit not beyond the point at which they would impede on overall prosperity. These insights have had a strong practical influence on approaches to the impact assessment of regulations and especially, analysis of costs and benefits, including distributional aspects and under conditions of uncertainty (OECD, 2010a).

Regulatory reform can be viewed strategically, in both developed as well as emerging markets, as one of the core instruments at the disposal of policy makers. The modern State will have to utilise its regulatory power wisely if it expects to be smarter in order to face challenges like the growing fiscal burden for providing key public services such as health, education and social insurance schemes, in establishing governance arrangements and rationalising complexities to manage the consequences of decentralisation, in supporting the investment climate and in reducing the state's role as an active investor in the economy.

In fulfilling these objectives in an effective way the overall framework of the formulation of laws and regulations requires an explicit whole-of-government approach for regulatory policy, including: responsibility for co-ordination and oversight of regulatory policy; a commitment to assess the cost-benefit of new regulatory proposals and existing regulations, and; the effective implementation of the principles of transparency and public consultation in regulatory decision making (OECD, 2010a).

In emerging markets, extensive state ownership and interference have led to regulatory uncertainty and a business climate that is not conducive to fair competition in open markets. The state's dual role as an active investor and referee has meant that the government is uniquely positioned to shape the applicable legal regime with its interests as shareholder in mind. In many cases, state ownership has created conflicts of interest for the authorities and distorted or suppressed competition. Regulatory institutions and processes are still young in emerging markets, and often regulatory authority is fragmented across a number of bodies, some of which have conflicting mandates. Inadequate co-ordination among government bodies at the national and sub-national levels is a widespread problem, leading to unclear, duplicative, and often conflicting efforts in a number of areas. The lack of sound regulatory governance has meant that popular perceptions of endemic patrimonial politics have persisted, with vested interests and collusion being assumed to operate at the expense of the national interest.

A recent OECD Regulatory Policy Working Paper, Regulatory Policy in India: Moving towards regulatory governance, looks at India’s existing regulatory regime and its evolution in the last two and half decades. The mechanisms of regulatory governance have weaknesses, and in some cases have fallen short of expectations. The paper looks at India's uneven regulatory environment and how its legacy features constrain the evolution of regulatory governance.

Foremost is the difficulty in designing and implementing regulatory policies given the government's inclination to maximize its revenue at the expense of social welfare. This trade-off has compromised effective regulation in the country because of a lack of understanding of what constitutes the objectives of regulatory governance. The paper highlights how the dichotomy between the interests of governments and businesses, as well as that of citizens, has manifested itself over the years in four distinct sectors i.e. mining, hydrocarbons, power and telecoms.

Basic regulation in India is implemented via the concerned line ministries, which may proceed to create industry-specific regulatory authorities that have varying degrees of autonomy, functions, and power. There are significant variations in the structure of the governing bodies, tenure of the members, sources of finances, and interface with the government. A noticeable feature of many of the regulators in India is that they are charged with the promotion and development as well as the regulation of a certain industry. That can result in the regulator thinking of the interests of the industry rather than the users of the industry.

In sectors like insurance, coal, petroleum, telecoms, banking, regulatory strategies are hampered by the presence of State owned firms. The inadequate institutional distance between regulators and state-owned firms, especially when there are no firewalls between them, has meant that the regulators have not promoted enough competition.

In these areas, the State is obliged to play a dual role: i.e. that of market regulator when it is also the owner of commercial SOEs, particularly in newly deregulated, often partially privatised industries. Whenever this happens, the State is inevitably conflicted in its opposing interests as: first, a major market player/firm owner in its own right, and second, as an arbitrator in the (supposedly) neutral, impartial, dispassionate role of regulator.

Regulators are expected to behave independently, and the challenge of independence is to avoid capture by interest groups who stand to benefit from regulation. It is equally significant to avoid regulatory capture by local politicians. Local politicians are attracted by the possibility of large economic rents in perpetuity. Too often, regulators have actively internalised political sentiments in their decision-making. In addition, the elite governmental bureaucracy has a ubiquitous presence in regulatory bodies. Regulatory independence from the executive is difficult to administer if regulators themselves come from a career backdrop of directing political decisions. This strain is exacerbated when regulators are appointed directly from senior governmental positions, requiring them to shift, from administering and defending government positions, to acting as an impartial referee (Dubash, 2008).

Many areas, such as agricultural markets, warehousing, or land, require coordinated approaches to regulation (both rule-making and enforcement) by the central government, and sub-national governments at the state and city levels. Economic liberalisation, coming on the heels of political federalisation, has transformed federal –state relations unleashing unintended and unplanned decentralisation (Sinha, 2004). Any regulatory reform agenda depends crucially on a close co-operation between different levels of government. Federal-state relations have been affected significantly with the rise of multi- party coalition governments and alliance politics in the 1990s. Coalition and alliance partners from states have become progressively more powerful at the national level and more capable of bargaining with the national government. That political reality has added considerable complexity to the environmental and social dimensions of economic decision-making which need the cooperation, and an explicit ethos for regulatory governance, of both national and state governments. The need for multi-level policy coordination has been felt making way for the creation of technical and regulatory agencies at various levels, at times adding to the complexity of policy processes, at others to the bypassing of traditional forms of accountability at all levels (Arora, 2014).

In addition to the legacy features of India’s regulatory environment, the country lacks a coherent policy on regulation. A whole of government policy towards "regulating" would provide the connectivity of different reform efforts and help the concerted effort towards regulatory governance instead of disconnected regulatory reforms. This may include a combination of creating or enabling institutions to embed good regulatory principles into their functioning, but also include the systemic implementation of good regulatory practices such as regulatory impact assessments, public consultation and administrative simplification in priority sectors.

Some sub-national regulators in the power sector and the airports regulator have embedded stakeholder engagement with discernible positive outcomes. the more active use of Regulatory Impact Assessment (RIA) and stakeholder consultation, can inform the government on the cost of some of the trade-offs that India faces in the design of its regulatory policy. Although there exists a certain consensus on the importance of RIA and half-hearted efforts have been made so far to implement it, lack of political will, capacity constraints and limited awareness amongst other stakeholders are impeding its further application. Experience with regulatory governance in the last two decades has resulted in the Regulatory Reform Bill 2013 which intends to legislate an overarching regulatory law to introduce further regulatory reforms and standardise some basic institutional features and processes across all regulatory bodies. The OECD would welcome the opportunity to engage with the NITI Aayog during the redrafting process of this bill.

In addition, India could learn from the experience of both mature and young regulatory governance countries in implementing its regulatory policies. Malaysia which has undertaken large market reforms leading to initiatives for greater regulatory coherence. Australia and New Zealand’s Productivity Commissions, show, most importantly, that the regulatory environment needs to be constantly evaluated to make sure it is keeping pace with the changing technology, business environment, and consumer needs and demands (OECD 2010b). The United Kingdom’s Regulatory Policy Committee provides opinions and scrutiny over the quality of analysis by government departments and are engaged in setting "regulatory guidance" across the government. Korea's Regulatory Reform Committee drives forward the regulatory reform agenda (OECD, 2015).

Bibliography

OECD (2010a). 'Regulatory Policy and the Road to Sustainable Growth', OECD Publishing, Paris.

Dubash, Navroz (2008). 'Institutional Transplant as Political Opportunity: E-Practice and Politics of Indian Electricity Regulation', Comparative Research in Law & Political Economy Research Paper No. 31/2008.

Sinha, Aseema (2004). 'The Changing Political Economy of Federalism in India: A Historical Institutionalist Approach', India Review, Vol. 3, No.1.

Arora, Dolly (2014). 'Trends in Centre-State relations', Indian Institute of Public Administration, New Delhi.

OECD (2010b). 'Review of Regulatory Reform: Australia', OECD Publishing, Paris.

OECD (2015). 'Regulatory Policy Outlook', OECD Publishing, Paris.


Lalita Som has worked for the Organisation of Economic Cooperation and Development, Paris. She can be reached at lalita.som@gmail.com

Wednesday, May 24, 2017

Interesting readings

The hazards of farm loan waivers by Tanika Chakraborty and Aarti Gupta in Mint, May 24, 2017.

Workers At Tata's Sanand Plant Have Been Awaiting Wage Hikes For Over Two Years, As Unfair Labour Practices Abound by Surabhi Vaya in The Caravan, May 23, 2017.

Banking ordinance opens up Pandora's box by Rajeswari Sengupta and Anjali Sharma in Mint, May 23, 2017.

As Modi and his right-wing Hindu base rise, so too does a celebrity yoga tycoon by Rahul Bhatia and Tom Lasseter in Reuters, May 23, 2017.

Where are the 10 million jobs the govt promised? by Mahesh Vyas in Business Standard, May 22, 2017.

Medicine Is Going Digital. The FDA Is Racing to Catch Up by Megan Molteni in Wired, May 22, 2017.

India's New Tax Is Too Complicated by Mihir Sharma in Bloomberg, May 22, 2017.

Why India needs another statistical revolution by Pramit Bhattacharya in Mint, May 22, 2017.

The New IIP Series: Necessary But Not Sufficient by Deep Narayan Mukherjee in Bloomberg, May 20, 2017.

The Real Power of Journalism? Blockbuster Scoops by Liz Spayd in The New York Times, May 20, 2017.

Washington Post, Breaking News, Is Also Breaking New Ground by James B. Stewart in The New York Times, May 19, 2017.

The Most Important Scientist You've Never Heard Of  by Lucas Reilly in Mental Floss, May 19, 2017.

China Is Building Its Way to an Empire by Noah Feldman in Bloomberg, May 18, 2017.

Yes Bank : RBI Finds 5x More NPAs Than Bank Reveals, Bank Says It's Not Hiding NPAs by Shreesh in Capitalmind, May 17, 2017.

President Trump needs single-page memos filled with charts and his name for first foreign trip by Jason Silverstein in NY Daily News, May 17, 2017. In this: Trump has admitted many times that he likes to avoid reading on the job. He told Axios in January that he likes "bullets" and "as little as possible" on his intelligence briefings, which he rarely attends anyway. He also seemed to admit on the campaign trail that he never reads books.

How army rations helped change food by Veronique Greenwood in BBC, May 16, 2017.

Walmart and Banking: It's Time to Reconsider by Lawrence J. White in Money and Banking, May 15, 2017.

Platonically irrational by Nick Romeo in Aeon, May 15, 2017.

Ease of business still just lip service; red tape, taxes put brakes on Modi's Make In India push in The Economic Times, May 14, 2017.

Chasing Cures for Deadly Scourges, and Getting in Our Own Way by Clyde Haberman in The New York Times, May 14, 2017.

Notes From An Emergency by Maciej Ceglowski on Idle Words, May 10, 2017.

Is India lying about its world beating economy? by Derek Scissors in AEI, May 6, 2017.

American banks think they are over-regulated in The Economist, May 4, 2017.

Tuesday, May 16, 2017

Interesting readings

Does the ordinance solve the banking crisis? by Ajay Shah in Business Standard, May 15, 2017.

Don't expect the next generation to save liberalism by Mihir Sharma in Mint, May 15, 2017.

How Google Took Over the Classroom by Natasha Singer in The New York Times, May 13, 2017.

A Run for Their Money: The Struggle to Exchange Demonetised Notes Did Not End in December at the RBI's Branch in Delhi by Ashish Malhotra in The Caravan, May 13, 2017.

The Nepal-Sikh Alliance That Could Have Changed History by Amish Raj Mulmi in The Wire, May 12, 2017.

The satellite imagery in Google maps and Google earth has gone from 5m to 1m resolution! 'Lost' forests found covering an area two-thirds the size of Australia by Andrew Lowe And Ben Sparrow in Phys, May 12, 2017.

The woman who saved old New York by Jonathan Glancey in BBC, May 12, 2017. She is celebrated in Seeing like a State.

Bankers, proxy firms question sudden orders for transferring CEOs of PNB, BOI by Gopika Gopakumar in Mint, May 12, 2017.

Demonetisation and the Delusion of GDP Growth by Ritika Mankar and Sumit Shekhar in Economic and Political Weekly, May 6, 2017.

Comey's Firing Is a Crisis of American Rule of Law by Noah Feldman in Bloomberg, May 10, 2017.

Scaling the World's Most Lethal Mountain, in the Dead of Winter by Michael Powell in The New York Times, May 9, 2017.

Only 36% of Indian engineers can write compilable code: study by Sam Varghese in Itwire, May 9, 2017.

What Happens When Authors Are Afraid to Stand Alone by Jason Guriel in The Walrus, May 9, 2017.

This data set took six years to create - Worth every moment by Hudson Hollister in Data Coalition , May 9, 2017.

Indian Parliament does not make laws, and MPs have little scope to keep govt accountable by Athreya Mukunthan in The News Minute, May 8, 2017.

China faces resistance to a cherished theme of its foreign policy in The Economist, May 4, 2017.

Why You Need More Dirt in Your Life by Simon Worrall in National Geographic, April 30, 2017.

Irreplaceable Pioneer - Obituary: Ravi Dayal (1937-2006) by Rukun Advani in The Telegraph, June 11, 2006.

Monday, May 15, 2017

Author: Pramod Sinha

Measurement of exports in India

by Radhika Pandey, Ajay Shah and Pramod Sinha.

The Indian statistical system has many difficulties. In general, a certain mistrust of official statistics is well placed. Every user of data must skeptically examine all data that is sought to be used. In this article, we kick the tyres of exports data, juxtaposing two different sources. We are pleased to report that there is no large discrepancy. We conjecture a third possibility for constructing a quarterly measure of exports, based on firm data, and find that this does not work out. In the future, it may work, thus giving a 3rd measure of quarterly exports.

There are two independent sources of exports data:

  1. RBI produces the Balance of Payments data. This obtains information about the exports of goods and services by watching flows of money through banks. This is released quarterly.
  2. The Department of Commerce (DGCI&S) releases monthly data for exports of goods (only). This is based on the daily trade data that it receives from Customs authorities, SEZs and Ports. The phrase 'exports' is used when describing this data, but it is important to always refer to it as 'merchandise exports' or 'exports of goods'.

In order to assess the sanity of these two series, we compare the year-on-year change for them against each other.

The above graph compares the year-on-year change for the BoP exports and the merchandise exports series. Although varying in magnitude, the figure shows broad similarity in the ups and downs in the two series. The rank correlation between the two is 0.93. This seems sound.

The above graph plots the seasonally adjusted point-on-point growth (annualised) for the two exports series. This uses our work on seasonal adjustment. We observe similar trends in the two series. The rank correlation here is 0.83, which is mildly worrisome.

Can firm data yield a third measure of exports?

Large firms are important in India's exports, across both goods and services. As an example, in 2014-15, of the total exports of goods and services of USD 474.24 billion, the annual report data for 4666 exporting companies in the CMIE database reveals exports of USD 248.60 billion. Hence, we wonder: Could we use firm data to construct on exports time series?

The legal framework on reporting of annual financial statements requires that companies report their export income. Section 134 (3)(m) of Companies Act, 2013 states:

There shall be attached to statements laid before a company in general meeting, a report by its Board of Directors, which shall include: ---(m) the conservation of energy. technology absorption, foreign exchange earnings and outgo , in such manner as may be prescribed.

Rule 8(3)(C) of the Companies (Accounts) Rules, 2014 states:

The report of the Board shall contain the following information and details, namely-- ---(C) Foreign exchange earnings and outgo The Foreign Exchange earned in terms of actual inflows during the year and the Foreign Exchange outgo during the year in terms of actual outflows.

This clarity in legal drafting shapes the disclosure of export income of firms in their annual reports. A large chunk of firms disclose their export income in their annual reports. As an example as on 31st March, 2015, out of 4038 listed firms, 1795 firms are identified as exporters using this annual filing of financial statements. We could use quarterly data for these firms, which is required to be disclosed by all listed companies, to construct an exports measure. In terms of methods, we could do for exports what we have done previously for net sales using firm quarterly data.

When we turn to quarterly data, however, the legal instruments that define disclosure requirements do not clearly require information about exports. Under Regulation 33 of the SEBI (Listing Obligations and Disclosure Requirements) Regulations, 2015, SEBI requires companies to diclose their quarterly results, following the accounting standards prescribed by the Central Government under Section 133 of the Companies Act, 2013. The field on "Income from Operations" includes: (a) Net sales/income from Operations, and (b) Other operating income. (See Annexure I of this circular.) As a result, most firms do not report their 'export income' in their quarterly disclosures. Some firms voluntarily disclose information on exports, but this is part of the "Notes" to financial statements. As an example see Point 4 under Notes of this report.

In the table below, we present a comparison of firms that report exports in their annual reports versus those that report export income as part of their quarterly disclosures. The table shows the proportion of listed exporting firms that report 'export income' in their quarterly disclosures. It shows that a miniscule proportion of firms that are `exporters' as disclosed in their annual reports publish export income as part of their quarterly disclosures.

Year Total Listed Firms Exporters (As per AR) Exporters (As per QR) Share of firms
2000-03-31 3976 1891 54 2.9
2001-03-31 4373 2046 76 3.7
2002-03-31 4800 2013 97 4.8
2003-03-31 4876 1986 106 5.3
2004-03-31 4820 1986 108 5.4
2005-03-31 4990 1982 118 6.0
2006-03-31 4998 2037 131 6.4
2007-03-31 4884 2067 135 6.5
2008-03-31 4882 2084 101 4.8
2009-03-31 4893 2086 109 5.2
2010-03-31 4897 2046 88 4.3
2011-03-31 4867 2032 78 3.8
2012-03-31 4755 1996 49 2.5
2013-03-31 4612 1958 42 2.1
2014-03-31 4436 1911 43 2.3
2015-03-31 4038 1795 34 1.9
 

Recent improvements in the quarterly disclosures of firms

On 5 July 2016, SEBI has modified the format for publishing financial results under the SEBI (Listing Obligations and Disclosure Requirements) Regulations. This new circular mandates that the quarterly financial statements should follow the format prescribed in Schedule III to the Companies Act, 2013. Schedule III to the Companies Act, 2013 lays down general instructions for preparation of balance-sheet and statement of profit and loss of a company. Through requirements of 'additional information', companies are required to disclose income from exports. The relevant text from the legal instrument is as follows:

5. Additional Information The profit and loss account shall also contain by way of a note the following information, namely-- (e)Earnings in foreign exchange classified under the following heads, namely-- I. Export of goods calculated on F.O.B. basis;...

The revised reporting format becomes applicable for the period ending on or after March 31, 2017. From March, 2017 onwards we hope to see improved reporting by firms of quarterly exports data, which would make possible the construction of a third quarterly exports time series.

Conclusion

The Indian statistical system is riddled with problems of measurement. Critical pillars of the statistical system -- NAS, NSSO, ASI, IIP -- are not trusted. Every user of data must bring critical thinking into the choice of data that will be used. Our analysis above is reassuring in finding agreement between exports data released by RBI and the Ministry of Commerce, and rejects the possibility of constructing an exports measure using the present framework of quarterly disclosures by listed companies. Going forward, with improved reporting by firms we could get a third measure of quarterly exports.


The authors are researchers at the National Institute for Public Finance and Policy.