Search interesting materials

Showing posts with label author: Aneesha Chitgupi. Show all posts

Thursday, September 19, 2024

Who is "innovative"? Unpacking the process of tax exemption grants to startups

by Aneesha Chitgupi, Karthik Suresh, and Diya Uday.

When private individuals spend resources on innovation, the ideas and benefits that arise spread to society at large. An underspend on innovation results in the market failure of "positive externalities". The state has an important role to play in solving this market failure by encouraging spending on activities that generate innovation (Mashelkar et al., 2024). In India, the government did so by: (i) building research organisations like CSIR and ISRO and hiring career scientists, and (ii) providing tax exemptions. The Income Tax Act, since its inception in 1961, has exempted expenditures on scientific research. Since 1996-97, goods used for R & D have been exempt from customs and excise duties.

In the last ten years, both the Union and various state governments have perceived "startups" as major drivers of innovation. A host of incentives have been put in place for them. These include: (i) reduced fees and priority in processing patent and design applications; (ii) full exemptions on income tax for the startup following approval from an Inter-ministerial Board (IMB); (iii) priority during public procurement, etc. However, in a previous article (Chitgupi et al., 2023), we analysed Indian patent filings and grants and found that, despite enjoying government incentives, the overall share of startups in patent filings and grants --- a proxy for innovation --- remains small. Moreover, only a few startups receive income tax exemptions aimed at spurring innovation (see Table 1).

Table 1: Overview of the landscape of startups
Startups 2023 2024
Total (registered and unregistered) 2,49,107 3,14,492
Registered as startups by DPIIT* 90,939 (36.5) 1,31,191 (41.7)
Granted tax exemptions by the IMB** 1,100 (1.2) 2,976 (2.3)

Table notes: * fraction of total startups;
** fraction of DPIIT registered startups.
Source: Authors' compilation and analysis

The income tax exemption for startups

Section 80-IAC of the Income Tax Act allows a one hundred per cent tax deduction for eligible startups. The aim is to reduce the tax and compliance burden in the initial years of incorporation. A startup is eligible if (i) it is a new business incorporated after 1 April 2016 and is not a reorganisation of an old business with old machinery; (ii) its total turnover does not exceed INR 100 crores; and (iii) it is "engaged in innovation, development or improvement of products or processes or services or a scalable business model with a high potential of employment generation or wealth creation". The body tasked with determining the eligibility of a startup is the IMB. It was set up by the DPIIT in April 2016 with three members, and it is an executive body with delegated powers.

In this article, we study the institutional design and functioning of the IMB under Section 80-IAC. Our findings suggest that the IMB's process is not optimised to deliver the statutory intent of tax exemptions to startups. We identify the bottlenecks that must be targeted for change and question the current incentive structure for startups to innovate.

Methodology

There is a perception that staffing an organisation with technocrats will solve the problems of the organisation. This is not a recipe for lasting success (Kelkar and Shah, 2022). It is instead important to draft rules and procedures that work within and beyond the administrative system and that provide the right incentives to bolster the purpose of the organisation, i.e., promoting innovation. We view the IMB as an executive body tasked with an executive function --- to determine whether a startup is eligible for an exemption under Section 80-IAC. We rely on principles of administrative law while examining the processes and workings of the IMB. In particular, we focus on (i) institutional design, (ii) transparency, (iii) administrative discretion, and (iv) accountability (see Table 2).

We integrate this framework with Adam Smith's Canons of Taxation which sets out design principles for efficient tax administration. These are: (i) the maxim of equality, i.e., the tax must be collected with equality before the law; (ii) the maxim of certainty, i.e., the time, manner, and amount of tax to be paid ought to be clear and plain to the taxpayer, (iii) the maxim of convenience, i.e., the tax ought to be levied at the time and in the manner in which it is most likely to be convenient for the taxpayer and (iv) the maxim of economy, i.e., the tax ought to be so contrived that it takes from the taxpayer as little as possible. Smith's canons are routinely used by Indian courts to test the constitutionality of actions by tax administrations. For example, in South Indian Bank Ltd. vs. CIT AIR 2021 SC 4266, the Supreme Court applied Adam Smith's canons to examine the tax exemption to income arising from interest paid by banks.

Table 2: Our framework for analysing the process of tax exemptions to startups
Parameter Administrative principleSmith's canons
Institution designClarity of purpose and processEquality, certainty, convenience.
Composition of the board
Reporting of conflicts of interest
Process transparency Publication of rules and processesCertainty
Administrative discretionIssue of reasoned ordersEquality, certainty
Administrative accountabilityProcedure for appeals from orders Equality, certainty
Audit oversight mechanism

We hand-collected and evaluated a sample of the minutes of the IMB meetings published on the Startup India portal to determine the eligibility of startups for tax exemptions. Our dataset comprises 52 decision documents out of the 72 available on the portal from 2016 to 2023, with the most recent document being from February 2023. There have been no additions to the IMB decisions since February 2023. Table 3 summarises our sample and provides insights into the total number of cases heard and the corresponding board decisions, forming the foundation of our study. Of the 72 IMB decisions published on the IMB website from May 2016 to February 2023, we have hand-collected data from 52 of these meetings, covering a total of 2,102 cases (72.2 per cent) each representing a startup.

Table 3: Overview of the sample data of IMB meetings
Year No. of meetings* No. of startup applications
Granted Rejected Deferred Total
2016 6 9 265 35 309
2017 3 21 201 141 363
2018 3 6 126 17 149
2019 8 109 1 57 167
2020 8 73 10 15 98
2021 10 80 13 9 102
2022 13 651 97 52 800
2023 1 112 2 0 114
Total 52 1061 715 326 2102
Table notes: *No of meetings from which data was used for this article.
Source: Authors' compilation from the Startup India website.

Results

Institution design

Clarity of purpose and process: The IMB has to decide whether a startup is eligible for the tax exemption. We find that the substance of the criteria to be applied by the IMB to determine eligibility for startup tax exemptions overlaps with the DPIIT criteria to register a startup. The need for a body like the IMB to reassess a startup on the same criteria is unclear. Despite this, only a small percentage of firms that have qualified the DPIIT's criteria meet the IMB's criteria. This violates Smith's canons of certainty and convenience because of the uncertainty of receiving the exemption despite having met the DPIIT's criteria. Table 4 compares the criteria for the IMB and the DPIIT to determine the eligibility of a startup for registration and grant of tax exemption. The criteria are substantially the same.

Table 4: Mandate of the IMB compared with the mandate of DPIIT for startups
IMB (for startup tax exemption) DPIIT (for startup registration)
Criteria 1 The entity's business involves innovation, development, deployment or commercialisation of new products, processes or services driven by technology or intellectual property Entity is working towards innovation, development or improvement of products or processes or services, or if it is a scalable business model with a high potential of employment generation or wealth creation.
Criteria 2 The entity was incorporated on or after 1 April 2016 but before 1 April 2025. Upto a period of ten years from the date of incorporation/ registration, if it is incorporated as a private limited company (as defined in the Companies Act, 2013) or registered as a partnership firm (registered under Section 59 of the Partnership Act, 1932) or a limited liability partnership (under the Limited Liability Partnership Act, 2008) in India.
Criteria 3 The entity's turnover does not exceed one hundred crore rupees. Turnover of the entity for any of the financial years since incorporation/ registration has not exceeded one hundred crore rupees.
Criteria 4 The entity has not been formed by splitting up, or the reconstruction, or using more than 20% by value of machinery, of a business already in existence. The entity shall not be formed by the splitting up or the reconstruction of an existing business
Source: DPIIT notification dated 19 February 2019 and Section 80 IAC of the Income Tax Act 1961

This is further highlighted through our analysis of the reasons for rejection of exemption claims. We map the reasons that are recorded in the minutes of IMB's meetings to the eligibility criteria set out in Table 4. We find that in 65 per cent of cases, a startup fails to get an IT exemption from IMB despite having met the same criteria for the DPIIT's requirement. Table 5 presents the percentage of exemption applications rejected based on previously assessed criteria. Further, 51 per cent of cases were rejected because the IMB determined that the startup was incorporated before 1st April 2016. At the outset, this is an objective criterion that the DPIIT and IMB should be able to agree on. Further, the cases in the Others category, which make up nearly 15 per cent of rejections, comprise criteria not specified under the law, such as shareholding patterns or other reasons said to be privately communicated to the startup.

Table 5: Overview of the reasons for rejection of applications for the IT exemption
Reasons for rejection No. of rejections Rejections as a fraction of total rejections (where reasons are given) (%)
Criteria 1 Lack of innovation, scope of scalability, and wealth generation 91 12.7
Criteria 2 Incorporated before April 2016 366 51.2
Criteria 3 Turnover exceeds hundred crore rupees 0 0
Criteria 4 Reconstruction of existing business 12 1.7
Others* 105 14.7
Rejection without reasons 141 19.7
Total 715 100

Table notes: * "Others" includes reasons not part of Criteria 1 to 4 in Table 4 above.
Source: Authors' compilation and analysis

Composition of the board: It is not apparent how the composition of the IMB is relevant for the purpose of the IMB. Since its constitution, the IMB has had a Joint Secretary from the Department for Promotion of Industry and Internal Trade (DPIIT), a scientist from the Department of Science and Technology, and a scientist from the Department of Biotechnology. For a year, between 2018 and 2019, the IMB also included representatives from SEBI, RBI, the Ministry of Corporate Affairs, the Ministry of Electronics and IT, and the Central Board of Direct Taxes. The IMB also has a "technical consultant". This consultant is an employee of the National Research Development Corporation (NRDC), a public sector undertaking owned by the Government of India. We are unable to find documentation that highlights the selection process and requisite qualifications of these members. All of them are ex-officio members. The role of the NRDC consultant has also not been clearly defined.

Process transparency

Publication of rules and processes: The rules or guidelines on the IMB's processes are not available in the public domain. For example, there are no guidelines on the basis of which the most important phrase in section 80-IAC, "innovation, development, deployment or commercialisation of new products, processes or services driven by technology or intellectual property" is determined. The lack of guidelines also violates Smith's canons of certainty and convenience. Guidelines are necessary for predictability for firms and greater accountability from the government. Other departments of the Indian government that carry out similar certification processes, such as the Department of Scientific and Industrial Research which certifies whether an applicant qualifies for tax exemptions for scientific research and R & D under Section 35(2AB) of the IT Act, have prescribed guidelines that companies can use to evaluate their chances of success.

Administrative discretion

Issue of reasoned orders: A central tenet of administrative law is that an order that carries negative consequences for an assessment should be well-reasoned. Unfortunately, non-speaking orders are frequently issued by Indian tax administrations (example, example). We do not have access to the text of the orders that are issued to individual applicants, so it is unclear whether detailed reasons are provided by the IMB while rejecting applications. However, from the minutes of the IMB meetings, we note that many companies are not provided with adequate and specific reasons for why their applications were rejected. This violates Smith's canons of certainty and equality. All deferred or rejected cases must be provided with reasons for their deferment or rejection. Published decisions help other startups better understand and comply with the eligibility criteria.

Figure 1 demonstrates whether the IMB communicated the reasons for the decisions taken on granting or rejecting the IT exemption for startups. We find that not all decisions are published with reasons. Even where applications are rejected, we do not see reasons being provided in every case. Of the 715 startups that were rejected, 19.7 per cent (141 startups) were not given reasons for rejection by the IMB. We further find that of the total 2,102 cases (Table 3) in our sample, deferred cases accounted for 15.5 per cent of them. Nearly 38.7 per cent of such cases were deferred without providing any reasons. Among the 1,061 startups granted the tax exemption, 67.9 per cent were granted without reasons being published. This creates ambiguity. In 15 per cent of cases, the IMB rejected applications for reasons other than those stated in the law (Tables 4 and 5).

Figure 1: Reason provided by application status across IMB decisions as a share of total cases

Figure 2, presents the share of cases where reasons were published across the decisions taken (whether granted, rejected, or deferred) by IMB from 2016 to 2023 across 52 decision documents. Since its inception, the IMB has published reasons for the majority of its decisions --- 67.3 per cent, 61.2 per cent and 73.2 per cent for 2016, 2017, and 2018, respectively. Across the years 2019, 2020, and 2021, IMB published reasons for all of its decisions. However, in 2022 and 2023, IMB published reasons for only 25.7 per cent and 1.8 per cent of decisions, respectively.

Figure 2: Reasons provided by year as a share of total cases

One may argue that since 2019, the IMB decision in favour of grants has increased from 65 per cent in 2019 to 98 per cent by 2023 and that the lack of reasons provided for the grant of IT exemption is not a major administrative challenge. We believe this has happened as the scheme gained maturity and there was a rise in the number of startups incorporated after 2016 that are applying for exemption under Section 80-IAC. It is important to note here that the cases brought to the IMB are recognised as startups by DPIIT, which follow similar criteria for establishing an entity as a startup with differences in the incorporation date, which is restricted to 'after April 2016' for IMB classification. This has been the major reason for rejections in the early years of the scheme (Table 5).

Administrative accountability

Procedure for appeals from orders: The right to appeal is another core tenet of administrative law. Judicial review of an administrative action ensures the lack of arbitrariness and improves administrative accountability. The IMB does not appear to have an appellate or review mechanism. It is unclear whether the decision of the IMB, not being one taken by the Income Tax Department, is appealable under the Income Tax Act. Moreover, this contravenes Smith's canon of equality. Startups that are aggrieved with the IMB's decision have to directly approach the High Court under a writ petition (example from Delhi HC). A case should lie before the High Court only if it involves a substantial question of law (Datta et al., 2017). This is because it is inefficient and costly to bring routine cases such as challenges to IMB's exemption decisions that do not involve a substantial question of law. This only adds further strain on the high courts' already burdened docket.

Audit oversight mechanism: The IMB is subject to audits by the CAG. However, no such audit of its functions has been carried out so far.

Discussion

Our findings indicate that the 80 IAC tax exemption is not working as desired. There are some core challenges in both the design of the exemption and its implementation.

Substantive challenges: The eligibility criteria to become a startup recognised by DPIIT and the eligibility criteria to be granted a tax exemption by the IMB are substantially the same (Table 4). However, startups are being granted recognition by the DPIIT but are being rejected for the tax exemption on the very same criteria by the IMB. If the criteria are substantially the same, a registered startup must automatically gain a tax exemption grant by virtue of qualifying as a startup by DPIIT. It is unclear why a separate application must be made involving both cost and time. Further, conversations with startup founders revealed that the 80-IAC exemption is not the impetus they need to spur innovation.

Implementation challenges: A key challenge is that rules and process guidelines on the grant of the IT exemptions are not available in the public domain. This has two drawbacks: (i) a startup applying for the exemption will not have a full picture of the process, and (ii) it allows room for administrative discretion, reducing the predictability of the outcomes of the applications. Further, the IMB does not publish reasons for rejection of applications consistently. This is imperative, as it will bring about transparency in the working of the IMB and also give potential applicants a sense of the reasons for rejection, acceptance, or deferment. The IMB process must also have a published procedure for appeals. Lastly, the composition of the IMB must be commensurate with its purpose. It is unclear why, for example, SEBI and RBI officers were part of the panel to determine "innovation". Our findings are in line with the recent observations of the Parliamentary Standing Committee on Commerce on the lack of clarity in the process for granting these exemptions. In response, DPITT has proposed to take steps to make the process of granting tax exemptions more "transparent" and "user-friendly".

Alternative strategies to encourage innovation

Building better supply-side incentives: Supply-side incentives are effective strategies to encourage spending on innovation. Tax exemptions could be one way forward, but not in their current form. We compared the Indian scenario to other countries to get some guidance. We find that while tax incentives are common for startups in many countries, and are the recommended way forward, the mechanism by which they are granted is different from the IMB. In the United Kingdom, "knowledge-intensive" companies can avail of tax benefits. Whether a company is knowledge-intensive or not is determined by HM Treasury under Section 252A of the Finance (No. 2) Act, 2015. The provision defines a "knowledge-intensive" company as one that: (i) spent at least 15 per cent of OpEx on research and development or innovation in at least one of the previous 3 years, or spent 10 per cent of OpEx in each of the previous 3 years, and (ii) is either likely to exploit intellectual property that it has created in the previous 3 years, or at least 20 per cent of the company's full-time employees (FTEs) are engaged in research and development or innovation. These FTEs must have at least a masters' degree. In Ireland, under Section 496 of the Taxes Consolidation Act, 1997 there is a negative list of industrial sectors and companies that do not qualify for the Startup Relief for Entrepreneurs (SURE) scheme if their main activities of business are in the specified sectors. Companies self-certify their applicability for the scheme, and there are stiff penalties in case they misinform the Revenue department. In Germany, the INVEST scheme of the Federal Ministry of Economic Affairs and Climate Action mentions that companies must (i) either hold a patent issued to them in any of the EU member states in the previous 15 years, or (ii) must be "innovative". "Innovation" is proved in a manner opposite of the Irish method, i.e. the company demonstrates that it is in fact working in the specified sector. The German Federal Tax Office may carry out random checks on whether a company is "innovative" by hiring an audit firm to independently assess whether it is truly generating output in its stated sector.

In all these countries, the government does not enter into the question of which firm is "innovative". The main reason for this is the difficulty in determining who is "innovative". Instead, countries identify priority sectors and grant incentives to all startups within the sector. That aside, in the Indian context, given the significant overlaps between the eligibility criteria for being a registered startup vis-a-vis the eligibility criteria for tax exemptions by registered startups, the government may consider a single window clearance system in which an eligible startup is registered and then is automatically given a tax-exempt status on account of being registered with the DPIIT. In doing so, the state will free up valuable state resources and capacity, which may be deployed for other purposes aligned with the intention of promoting innovation among startups.

Demand-side interventions through government contracting: As an alternative, some literature suggests that demand side strategies through public procurement will encourage innovation (Rothwell et al. 1981).

While the creation of the IMB and the government's focus on startups appears to be in response to a market failure, the design of the intervention has flaws. We note that "startups" are not necessarily major drivers of innovation in India. Firm size has no role to play in how innovative it can be. Therefore, tax exemptions for startups, even if they are "innovative", have little measurable effect on innovation in Indian society as a whole. Mashelkar et al (2024) recommend that the government "buy" i.e. contract out more research and innovation functions to firms in the private sector. The spillovers this can generate would be substantive and would have a multiplier effect. We already have many examples of the government choosing to do so e.g. the New Millennium Indian Technology Leadership Initiative (NMITLI) program of the Council for Scientific and Industrial Research (CSIR), Department of Space's (DoS) contracting with companies like L & T and Tata Elxsi to build rocket engines and recovery modules for the all-important Chandrayaan and Gaganyaan missions. These kinds of contracts should be done more often and frequently with all kinds of companies to build innovation and production capacity. Our recommendation in all cases is to pursue innovation by contracting out.

References

  1. Adam Smith, The wealth of nations, Fingerprint Classics, 2024.
  2. Aneesha Chitgupi, Karthik Suresh and Diya Uday, Are startups engaging in innovation in India?, The Leap Blog, 25 April 2023.
  3. Pratik Datta, Surya Prakash B.S., and Renuka Sane, Understanding judicial delay at the Income Tax Appellate Tribunal in India, Working Paper, National Institute of Public Finance and Policy, 13 October 2017.
  4. Ramesh Mashelkar, Ajay Shah and Susan Thomas, Rethinking innovation policy in India: Amplifying spillovers through contracting-out, Working Paper, XKDR Forum, 21 March 2024.
  5. Vijay Kelkar and Ajay Shah, In Service of the Republic: The Art and Science of Economic Policy, Penguin, 2022.
  6. R Rothwell and W Zegweld. Industrial Innovation and Public Policy: Preparing for the 1980s and the 1990s. In: London: Francis Pinter Publications (1981).

Aneesha Chitgupi, Diya Uday and Karthik Suresh are researchers at XKDR Forum. The authors thank Ajay Shah and two anonymous referees for their comments and inputs.

Saturday, August 24, 2024

Who lends to the Indian state?

by Aneesha Chitgupi, Ajay Shah, Manish Kumar Singh, Susan Thomas and Harsh Vardhan.

Public finance researchers in India have paid great attention to debt and deficits. By now, the main messages of the field have started sinking into common knowledge: that it is good to run primary deficits in most years, so as to create space to surge the deficit once in a while when faced with a crisis. There is an adjacent field of public debt management that is equally important. Here, the strategic question is: How should the government borrow? From whom? Debt management strategy has not received the required level of interest.

Strategic thinking in debt management

A sound public debt management strategy must cater to three objectives:

  • The mechanism for borrowing must not induce economic distortions upon the domestic economy.
  • It must create strategic depth of being able to borrow on a very large scale when faced with great challenges, once every few decades.
  • It must induce sustainable mechanisms for reasonably low cost borrowing, at reasonably predictable rates, for the long term.

There are four main pathways to choose from in debt issuance:

  1. Monetisation of the deficit. Here, the central bank distorts the monetary base with `fiscal dominance’ where it buys the bonds issued by the government.
  2. Coerced borrowing from financial firms. These are typically regulated firms, who are coerced using the tools of financial regulation.
  3. Borrowing from voluntary participants (domestic or foreign). This is done through local currency bonds issued domestically, possibly nominal and possibly inflation indexed.
  4. Borrowing abroad using foreign currency denominated bonds. As an example, this could involve Yen denominated bonds issued in London.

As with many other countries, we started out in India with the first method (monetisation of the deficit). This induces an economic distortion: the loss of monetary policy autonomy. A long journey of monetary policy reform took place, from the Ways and means agreement of 1993, to the Monetary policy framework agreement in 2015 that ushered in inflation targeting. This freed up monetary policy from the limitations imposed by debt management. In 2015, there was an attempt at institutional reform, in the form of the establishment of the Public Debt Management Agency (freeing up the Reserve Bank of India of the responsibility of issuing public debt), but this did not come to pass.

From 1993 onward, the main strategy for public debt management in India has involved method 2 in the list: a system of `financial repression’ where the government borrows from coerced financial firms. This is a tax upon financial intermediation. The interest rates discovered through government borrowing are important prices that impinge upon the economy. But these rates are distorted owing to the presence of coerced buyers of government debt. The lack of voluntary lenders creates the lack of strategic depth. The government is limited in how it can expand its borrowing when faced with special situations.

From the late 1990s onwards, economists and thinkers have sought to enhance fiscal prudence in India through the mechanism of fiscal responsibility law. It is increasingly clear that this does not work. In recent work, Datta et. al. 2023 show that the Indian constitutional arrangements frustrate the possibility of Parliamentary law imposing fiscal discipline upon the union government. Once this idea is internalised, there is one main path towards fiscal responsibility: market discipline. This requires removing the system of financial repression.

Who lends to the Indian state?

In this context, the question Who lends to the Indian state? attains importance. A recent paper by Aneesha Chitgupi, Ajay Shah, Manish Singh, Susan Thomas and Harsh Vardhan examines this question. For a period of 10 years, we assemble information from multiple sources, which were all available in the public domain, to examine the nature of lenders to the Indian state. Some discoveries that we make are:

  • The SLR went down in the last decade. This meant that the extent of bank funds mandated for the government decreased. However, the actual investments by banks in government debt securities was higher than what was mandated.
  • Simultaneously, there was major growth in the role of insurance and pension funds lending to the government. While de jure financial repression of banks declined, there has been no such retreat with pensions and insurance.
  • All the three groups of financial firms bought a lot more government bonds as compared with the de jure requirements. Excess ownership went from about 0 in 2011 to Rs.30 trillion in 2021.
  • How did the government increase borrowing over the last decade, while simultaneously elongating the maturity profile? The answer lies in (a) Strong growth in insurance and pensions industries, and (b) Excess ownership of government bonds by coerced industries.
  • The voluntary lenders are the private firms, MFs and FIIs, who are 4.8% of investors in the government debt market for 2021. India (along with China) remains an outlier in having very low borrowing from international debt markets.

Important questions for the future

This field is target rich with interesting questions, some of which are:

  1. Why do financial firms lend so much to the government?
  2. What will the structure of lenders to the government look like, 10 years out into the future?
  3. If a big surge in borrowing is required, where will it come from?
  4. How are households and firms changing their behaviour in response to the financial repression tax?
  5. What is the path to fiscal responsibility?

Conclusion

The field of public finance in India has studied deficits and debt. There has been work on the institutional arrangements for debt management (i.e. the establishment of the Public Debt Management Agency). There has been relatively little work on the economic reasoning, the strategic thinking for debt management. In this paper, we offer novel insights and facts for this journey. More research is required, at the interfaces between public finance, finance and public administration, to grow knowledge on the important field of debt management strategy.

Tuesday, April 25, 2023

Are startups engaging in innovation in India?

by Aneesha Chitgupi, Karthik Suresh and Diya Uday.

Introduction

What is a startup? The academic literature takes a broad view --- startups:

  • have a high growth rate (Moogk 2012),
  • have a lower number of employees (Beck et al. 2008),
  • are at the early stage of the life cycle of a firm (Eisenmann 2013, Stevenson and Jarillo 1990), and
  • are drivers of innovation (Cohen and Klepper, 1996).

However, governments across the world focus on the link between startups and innovation. In the Netherlands, a startup is defined as "a business that translates an innovative idea into a scalable and generic product or service, using new technology." In the United States, a startup is one that "has never been an SEC reporting company, uses invested capital, often from venture capital investors, to build an innovative growth focused, scalable business." The Israeli "innovation model" is "largely based on the creation of technological value, mainly in start-up companies and multinational corporations R&D centres".

This is true of the Indian government as well. The stated objective of the Startup India Action Plan of 2016 is to promote innovation. The idea that startups are innovative is also reflected in the draft Science, Technology and Innovation Policy of 2020) as well as foreign policy initiatives like the Engagement Group on startups at the ongoing G-20 Summit.

The Startup India Policy offers a suite of regulatory exemptions and incentives linked to innovation by startups. Two key components of this policy are: (i) reduced fees and priority in processing patent and design applications for startups, and (ii) full exemptions on income tax to the startup following approval from an Inter-ministerial Board (IMB). The Startup India Policy has been amended several times. Key changes relating to the definition of a startup have been:

  1. February 2016: a startup is (i) not older than five years from the date of its incorporation/registration, (ii) turnover in any of the previous five financial years has not exceeded INR 250 million, and (iii) it is working towards innovation, development, deployment or commercialisation of new products, processes or services driven by technology or intellectual property. The startup should develop and commercialise "a new or a significantly improved product or service or process that will create or add value for customers or workflow".
    To be registered with the DPIIT, as well as to qualify for the tax exemption, a startup needs to be recommended by a registered incubator, or an angel/private equity/ accelerator fund with at least 20 per cent funding, or by the Union or state government as part of a scheme to promote innovation, or it should have filed a patent.
  2. May 2017: the age of an eligible firm and the period for calculation of turnover was increased from five to seven years from the date of its incorporation/registration (ten for firms in the biotechnology sector).
    In addition to the definition, a startup may now also have scalable business models with a high potential of employment generation or wealth creation to gain benefits.
    To register as a startup and avail of the tax exemption from the IMB, a firm now only has to make an online application by providing the details of (i) certificate of incorporation/ registration and "other relevant details as may be sought", and (ii) a write-up about the nature of business highlighting how it meets the criteria in the definition. The DPIIT would consider "innovativeness" from a domestic standpoint. DPIIT may grant or reject recognition after review.
  3. February 2019: age requirement of an eligible startup was relaxed to ten years for firms across all sectors. The turnover limit was increased to INR 1 billion.

Given the emphasis on "innovation", we consider it important to examine whether India's policies are incentivising innovation by startups by asking the following questions:

  1. Are startups in India engaging in innovation?
  2. How innovative are Indian startups compared to non-startup firms?

To answer this, we require some well-accepted measure for studying startup innovation. We adopt the most popular method i.e. using patent fillings and grants as proxies to measure innovation (Wang 2018; de Rassenfosse 2019; Katila 2000). We chose this over other proxies like expenditure on R&D (Rothwell and Ziegler, 1981; Geroski, 1989). We examine our questions using patent filings and grants to startups. We also use a novel measure i.e. the benchmarks for innovation as defined under the Startup India policy. We found that startups are not driving "innovation" in the conventional sense of the term in India.

We lend new insights into the conventional wisdom on startups and innovation in India and highlight the need for a re-look at the current policy on startups in India.

Methodology

We use two methods to determine whether startups are engaging in innovation:

(i) Measuring innovation using patent applications and grants: We hand-collected data on patent filings and grants from the Indian Patent Office across different categories of entities for the years 2016-17 to 2020-21. We substantiate this data using the annual reports of the Department of Promotion of Industry and Internal Trade (DPIIT). We examined the fraction of patents filed and granted by startups over the years compared to other entities.

(ii) Measuring innovation using startup registration and granted Income Tax (IT) exemptions under the Startup India Policy: The Startup India Policy 2015 requires startups to be innovative to (i) register as a startup and (ii) be granted IT exemptions under the Startup India Policy read with section 80-IAC of the Income Tax Act. We collected data on the number of startups that have successfully received tax benefits (after being classified as innovative). We then calculated the fraction of startups that were granted exemptions versus total startup registrations. For this, we collected data on startup registrations, applications for IT exemptions and approvals to applications of IT applications for all states and UTs in India between 2016-2022. We aim to gain insights into how many startups are "innovative" according to the policy definitions of "innovation".

We also collect currently available data on the total number of startups in India with the number of startups that are registered with the DPIIT. However, this is only available for the current year. We aim to examine how many startups in India qualify under the policy definition of a recognised startup to examine the stringency of the definition of a startup.

We conducted a detailed analysis of startup policies in India to give us further insight into our results from (i) and (ii) above.

Results

Impressive growth rate in patent filings by startups but their overall share remains small: We examined patents filed and granted by Indian startups versus other Indian entities which include small firms, private and public firms, and natural persons. We did not include foreign firms and institutions filing for patents in India or Indian entities filing for patents abroad. We found, across the years, that the number of patents filed by startups has increased possibly on account of the fee waiver and fast-tracking of applications. We also see specific increases in the years in which these interventions were made (May 2017, February 2019) when patent filings doubled (see Figure 1). The CAGR for patents filed by startups and other entities show a disproportionate growth rate for startups at 54 per cent for the period between 2016-17 to 2020-21 which was nearly 12 per cent for other entities for the same period. We found that startups constitute a small proportion of the total patents filed in India when compared to other entities. Patent filings were largely driven by large firms and universities.

Figure 1: Fraction of patents filed by startups over non-startups (2016-17 to 2020-21)

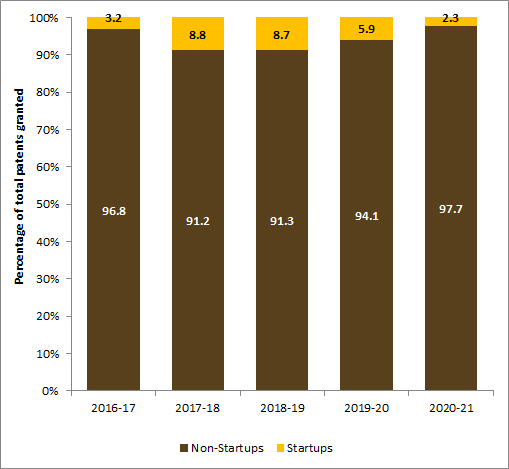
Disproportionately fewer startups were granted patents: The share of patents granted to startups peaked at 8.8 per cent during 2017-18, remained the same the following year and has declined since then. One reason for this could be that startups were obliged to file for a patent to receive registration under DPIIT as well as for applying for IT exemption. The reason for the drop in shares of both patents filed and granted during 2020-21 could be the removal of patents as a condition for registration of a startup and for IT exemption (in May 2017). We also believe that there could be an overall decline in the quality of patents filed. It appears that while the current policy has incentivised firms to file patents, their applications do not pass the more stringent test of proving innovation and hence they fail. The threshold required to grant a patent is strict and requires a firm to prove novelty, which is not the case at the application stage where anyone may file for a patent.

Figure 2: Fraction of patents granted to startups over non-startups (2016-17 to 2020-21)

Source: Annual reports of Indian Patents Office

Figure 1 showed that the share of patents filed by startups in total patents filed was rising during the period 2016-17 to 2019-20. This is not the case for the share of patents granted (Figure 2).

Less than two-fifths of startups registered with DPIIT qualify for benefits: We find that since 2016, the number of companies registered as startups under the Startup India Policy with the DPIIT has increased in absolute terms. However, the growth rate over time has reduced. We further find that out of all the startups that exist in India, only a percentage of them qualify as "startups" under the Startup India Policy and have been registered as such. For instance, there are 2,49,107 startups in India (as on February 2023) out of which only 90,939 (36.5 per cent) are registered by the DPIIT as startups. It is possible that the unregistered startups have either not applied to be registered or have not qualified as startups as per the definitions. This raises the question: is our current definition of a startup under the Startup India Policy the right one? Should we rethink the definition to extend the benefits of the policy to more startups on the ground?

Low grant percentage of IT exemptions for startups: We found that out of the total number of registered startups, less than 2 per cent of startups have been granted the IT exemption, signifying that few startups have been certified as innovative as described in the Startup Policy on external scrutiny by the IMB. We validated this with data on the number of applications for the IT exemption for the year in which this data is available (2017) and found that 90 per cent of registered startups applied for the IT exemption in that year. This indicates that the low fraction of startups receiving IT exemptions is not for the lack of application on the part of registered startups. This has even prompted questions in Parliament.

To be registered as a startup under DPIIT, a startup has to only declare that they are working towards innovation, whereas to obtain an IT exemption, the fact of innovation is scrutinised by the IMB based on specific criteria because of which a startup may not qualify. It is possible that, at registration under the policy a startup need not demonstrate innovation but only declare it, however, for the IT exemption it must now demonstrate and prove innovation in the manner specified in the policy. It appears that few startups are actually being innovative according to the Startup India Policy. Table 1 summarises our findings.

Table 1: Total startups registered and granted IT exemptions based on whether they are "innovative" (2015-2016 to 2020-21).

Year Number of startups registered Growth rate (%) No of startups granted 80-IAC Fraction of total (%)
2015-16 471 -- 7 1.5
2016-17 5233 1011 69 1.3
2017-18 8775 68 18 0.2
2018-19 11417 30 162 1.4
2019-20 14596 28 83 0.6
2020-21 20160 38 70 0.3

Source: Authors' calculations from DPIIT data

Limitations: (i) We do not have access to consistent yearly data on the number of total startups v. those which are registered. (ii) We do not have data on the pre-policy period. (iii) Our present study is not focused on industry-level features. We intend to pursue this in the next leg of our study.

Discussion

Our findings indicate that both measures --- IT exemption grants based on innovation and patents filings and grants --- suggest that innovation in India does not consistently emerge from startups. Instead, our findings are in line with studies in other jurisdictions which suggest that large firms undertake most innovation on account of their risk appetite and R&D capacity (Cohen and Klepper 1996, Symeonidis 1996). Our findings are also aligned with reports that indicate large firms and universities engage most in innovation if measured by patent filings in India. Is this, however, a true picture of innovation on-ground? And what are the implications of our findings for current innovation policies for startups?

The literature makes the case for government intervention on startup innovation citing the disparity in the ability to compete as a market failure (Wang 2018, Symeonidis 1996). The argument is that startups require a boost to even out the playing field as they are unable to compete with larger firms with more resources. Our findings lend some support to this by demonstrating that (i) startups in India are not innovating as much as large firms, and (ii) patent filings by startups have increased since the Startup India policy came into effect. We also, find that patent grants to startups have not increased. Therefore, despite government intervention in India, startups are not driving innovation. Some explanations for this are as follows:

  • The current set of incentives may not be sufficient to drive startups to innovate more. We find some support for this in the literature that finds that supply-side policies alone (e.g. subsidies) are not sufficient to stimulate innovation (Geroski 1989). Focusing on additional demand-side measures such as public procurement of innovation from startups may trigger greater innovation as it reduces the market risk for innovators (Rothwell et al. 1981; Tiwari 2017).
  • Conventional notions of innovation are linked to "novelty" through patenting which is a very high standard for measuring innovation. In reality, startups in India may be engaging in innovation which is not eligible for conventional patents such as technological improvements or modifications suited to the domestic context. Reports suggest that startups in India adopt rather than innovate in the conventional sense. For instance, India is using the technology adoption route for developing Web3.
    Another reason could be that Indian firms are innovating but are not registering patents in India. Reasons for this range from poor enforcement in India to sector-specific commercial preferences. An example of the latter is the semiconductor sector --- India has a large chip design industry but this work is done on a contract basis for US semiconductor firms which file their patents in the US.
    Therefore, patents may not be the best way to measure innovation in India. Current startup policies in India should re-think the definition of "innovation" and make it more suited for the Indian context.

We gain some insights from the innovation-linked incentives that are offered by other countries. In South Korea, which has the highest per-capita granting of patents in the world, all startups irrespective of how innovative they are qualify for reduced fees in patent filings and certain tax exemptions available to SMEs. South Korean policy appears to focus more on promoting linkage between large and small firms to promote networking and market access. In the Netherlands, which ranks ninth in the world in patent filings, vouchers are given to SMEs for patent filing that cover up to 75% of costs. The Dutch Tax Office evaluates and grants specific tax incentives for "technical-scientific research" and "development projects". Both these countries, considered to be highly innovative, have tax schemes that are targeted at specific outcomes and there are some general exemptions for patent filings. India could perhaps learn from these policies.

Conclusion

We set out to answer two questions in this article: Are startups engaging in innovation? How innovative are startups compared to non-startup firms? Our findings using both measures indicate that startups are not driving "innovation" in the conventional sense of the term in India. However, many Indian startups have scaled up by engaging technology towards creative solutions in many industries such as payments (Paytm), e-commerce (Meesho), credit cards (CRED) and healthcare delivery (PharmEasy). While these firms may not do well on the conventional measures of "innovation", they have played a role in encouraging entrepreneurship to solve everyday challenges, all while benefiting their shareholders.[1] Policy in India must, therefore, be suitably modified to recognise such contributions towards innovation. This is an emerging idea that Indian policymakers are increasingly acknowledging. For instance, the Economic Advisory Council to the Prime Minister of India noted the importance of FDI from tech transfers as a key source of promoting innovation in India. We need to think harder about what "innovation" means in India and what role should the government play in encouraging innovation.

In further research, we will analyse the pattern of patents filed and granted across various industries to understand which sectors are more innovative in the traditional sense. We will also examine the firms that have received the IMB's certification of being "innovative" to (i) study the characteristics of these firms and the industries to which they belong, and (ii) study the trends in the grant of certification by the IMB for innovation to startups. This will help us gain a more nuanced understanding of what drives innovation among startup firms in India.

Footnotes

[1] According to its Red Herring Prospectus filed at the time of its IPO (November 2021), Paytm does not own any patents.

References

  1. Tom Eisenmann, Entrepreneurship: A Working Definition. Harvard Business Review, January 10, 2013.
  2. Stevenson, H. H., and Jarillo, J. C., A Paradigm of Entrepreneurship: Entrepreneurial Management. Strategic Management Journal, 11 (1990), 17-27.
  3. Dobrila Rancic Moogk, Minimum Viable Product and the Importance of Experimentation in Technology Startups, Technology Innovation Management Review, March 2012.
  4. Beck, Thorsten and Demirguc-Kunt, Asli and Maksimovic, Vojislav, Financing patterns around the world: Are small firms different?, Journal of Financial Economics, Volume 89, Issue 3, September 2008, Pages 467-487.
  5. Jue Wang. Innovation and government intervention: A comparison of Singapore and Hong Kong. In: Research Policy 47.2 (Mar. 2018), 399-412.
  6. Wesley M Cohen and Steven Klepper, A Reprise of Size and R&D. In: Economic Journal (1996), 106 (437), pp. 925-51.
  7. Gaetan de Rassenfosse, Adam Jaffe, and Emilio Raiteri. The procurement of innovation by the U.S. government. In: PLOS ONE 14 (Aug. 2019), pp. 1-11.
  8. Katila, R. Measuring innovation performance. In: International Journal of Business Performance Measurement (2000), 2: 180-193.
  9. P. A. Geroski. Entry, Innovation and Productivity Growth. In: The Review of Economics and Statistics 71.4 (1989), 572-578.
  10. R Rothwell and W Zegweld. Industrial Innovation and Public Policy: Preparing for the 1980s and the 1990s. In: London: Francis Pinter Publications (1981).
  11. G. Symeonidis, Innovation, Firm Size and Market Structure: Schumpeterian Hypotheses and Some New Themes, OECD Economics Department Working Papers, 161 (1996).
  12. S.A. Low and M.A. Isserman. Where Are the Innovative Entrepreneurs? Identifying Innovative Industries and Measuring Innovative Entrepreneurship. In: International Regional Science Review 38.2 (2015), 171-201.

Aneesha Chitgupi, Karthik Suresh and Diya Uday are researchers at XKDR Forum. We thank Devendra Damle, Josh Felman, Dr. R. A. Mashelkar, Amey Mashelkar, Megha Patnaik, Arjun Rajagopal, Anjali Sharma and the anonymous referees for their feedback and comments.

Saturday, November 05, 2022

Learning by doing and public procurement in India

by Aneesha Chitgupi, Abhishek Gorsi, and Susan Thomas.

Introduction

State objectives can feature a mix of `make' (i.e. build an organisation, recruit people) vs. `buy' (i.e. contract to a private person for the same task). While private persons are, in general, more efficient than a comparable government organisation, the `buy' pathway is not a panacea when there are bottlenecks in state capacity to contract. Understanding how to achieve capacity in government contracting is one of the critical components of the overall question of enhancing state capacity in India.

How has this tradeoff evolved over time? Generally, when contracting capabilities go up, the fraction of work that is contracted-out goes up. Chitgupi and Thomas (2022) find that the government procurement spending has been at a steady 17 percent of the total expenditure across multiple years, which suggests a lack of movement on contracting capabilities.

What about cross-sectional variation in contracting capability between spending units? Sharma and Thomas (2021) finds that procurement expenditure varies significantly across ministries in 2016-2017, with a few ministries accounting for the larger share of procurement. This would, of course, largely reflect differences in the nature of their work.

In this article, we obtain insights into contracting capabilities by examining procurement under-spend across ministries and across time. We recognise that state capacity in procurement includes multiple dimensions: achieving a targeted level of quality at the minimum cost and on time. Our question is a more basic one about whether the spending happens at all. It requires a certain level of contracting capability in order to actually achieve the budgeted procurement expenditure. We then consider the role of learning by doing in procurement.

An insight in the field of state capacity is that it is extremely sticky; changes to state capacity arise only slowly (Kelkar and Shah, 2022). State capacity emerges from the organisation design (mandate, governance, organogram, processes, the feedback loops of accountability mechanisms). Repetition of the same task, over and over, under the influence of accountability mechanisms, induces the slow process of building capability. By this reasoning, we hypothesise that state entities which procure on a sustained basis will build the organisation design and capacity to doing procurement efficiently, and vice versa. The lack of sustained procurement activity will then predict procurement underspend.

Approach

In previous work, we developed the methodology to estimate the fraction of procurement in the accounts reported in the Detailed Demand for Grants (DDG) document published by a ministry. The DDG for a given year reports two sets of numbers by item head: the amount budgeted for the year, the amount actually spent two years previously. So, the DDG in 2016 for (say) the Ministry of Health and Family Welfare will report the budgeted amounts for 2016, as well as the amount spent in 2014. These are reported by item head, and allows us to calculate the actual amount spent but with a lag of two years.

For our current analysis, we calculate what was budgeted and what was actually spent on procurement, across ministries and across years. We use these to estimate the procurement spending gap for the ministry as:

100 x (actual procurement spend - budgeted procurement) / budgeted procurement

A negative spending gap has the ministry spending less than planned. If procurement capacity is the dominant factor driving the ability to procure, then we would say that a ministry with good procurement capacity will have a procurement spending gap close to zero. Further, if the learning-by-doing hypothesis holds, then those ministries that budget consistently for procurement will have built procurement capacity, and be able to show procurement spending gap close to zero.

Other than procurement, a ministry spends on operational expenses like salaries and pensions, and on grants-in-aid and schemes. These do not depend upon specialised capacity as with the contracting capacity required in the case of procurement spending. As a benchmark, we also calculate the total spending gap as the difference between the actual and budget total spending of the ministry, as a fraction of the total budgeted spending. We use the total spending gap of the ministry to benchmark their overall spending capacity.

We calculate the total spending gap of the ministry as:

100 x (actual total spent - total budgeted) / total budgeted

For our analysis, we do the following steps:

  1. Estimate the amount of procurement expenditure for each ministry for each year for which we are able to obtain the DDG. We use this to identify which ministries have consistently higher fraction of their expenditure in procurement.
  2. Estimate the procurement under-spend for each ministry across different years.
  3. Examine whether there is a link between the ministries with a higher fraction of procurement expenditure and a relatively lower procurement under-spend.

Data

We collect the DDG published by the ministries of the Union Government to estimate the procurement and total spending gaps. The estimation procedure described in Sharma and Thomas (2021) requires the object head wise expenditure to be disclosed in the DDG. This level of information has been consistently disclosed across all ministries (other than for the Railways ministry which has a more complicated accounting structure) from 2014-2015 onward. The latest available DDGs are from 2020-2021.

There remains challenges in accessing the DDGs reliably for all the Union government ministries. In our exercise, we are able to locate the DDGs consistently from 2014-15 to 2020-21 for 10 ministries: Civil aviation, Coal, Environment, Finance, Health and Family Welfare, Home Affairs, Housing and Urban Affairs, Rural Development, Road Transport and Highways and Law and Justice.

For seven of these ministries, the DDGs contain ministry level object head wise expenditures directly. For three ministries, we had to sum up the expenditures across department DDGs. These include: the Ministry of Finance which is the sum of Economic affairs, Financial services, Revenue, Expenditure, and DIPAM. The Ministry of Health & Family Welfare is the sum of Health & Family Welfare, and Health Research. The Ministry of Home Affairs (MHA) covers Home Affairs, Cabinet, Police, and 8 departments for the UTs. The expenditure of Home Affairs, Cabinet and Police make up 74 percent of the MHA expenditure. In our analysis, we report the procurement expenditure for the MHA as the sum of these three departments, and do not include the UT departments in the analysis.

All rupee values used in these calculations are adjusted for inflation using the CPI index. The spending gaps are calculated for each year, from 2014-15 to 2018-19.

Is there a link between consistent procurement and lower procurement under-spend?

We organise our findings into three figures, where each is in the form of a heat map. In these graphs, each row is a ministry, where the values going from left to right are those for 2014-2015 to 2018-2019. The deeper / stronger the colours, the higher the values. In all three figures, the order of the ministries stay the same: in descending order of estimated procurement expenditure in 2014-2015. The ministry with the highest procurement spending is on top.

In Figure 1, we present the estimated procurement spending of the 10 ministries. The Ministry of Road Transport & Highways had the highest estimated procurement spending (in Rs. billion) in 2014-2015, and the ministry of coal had the least. There is large variation in the procurement spend across the 10 ministries, as described in Sharma and Thomas (2021). Ministries such as Coal and Rural Development spend less than Rs. 1 billion on procurement and have consistently done so over last 5 years. Ministry of Road Transport & Highways is the top procuring ministry followed by Home Affairs, of which Department of Police is largest procurer. There is more variation across the years for the remaining ministries. For example, the ministry of Health & Family Welfare shows an increased estimated procurement expenditure in 2017-2018 compared to other years in this period. The Ministry of Law & Justice has a steadily increasing procurement expenditure during this period.


Figure 1: Estimated procurement expenditure by ministry, 2014-15 to 2018-19


Figure 2 presents the estimated procurement spending gap from 2014-15 to 2019-20. Green stands for positive values (which is over-spending or under-budgeting). Red stands for negative values (which indicates under-spending or over-budgeting). Except for a few years, most ministries tend to under-spend. The exception is the Ministry of Road Transport & Highways, which is also the top procuring ministry.


Figure 2: Estimated procurement spending gap (%) by ministry, 2014-15 to 2018-19

Figure 2 also shows a sharper amount of under-spending towards the latter part for some of the ministries. These include Finance, Civil Aviation, Rural Development and Coal. This contradicts the proposition that procurement capacity is systematically increasing over time.

These ministries also have a lower fraction of procurement in their spending. These ministries are less likely to develop procurement capacity. Among ministries with similar procurement spending patterns, the Ministry of Environment appears to be building procurement capacity, with a procurement spending gap closer to zero.

Lastly, Figure 3 presents the spending gap for total expenditure for these ministries across time. There is much more capacity among the ministries in managing to spend their overall budgets. Most of the heat-map shows colours mapping to values closer to 0. In fact, there is more evidence of over-spending than under-spending compared to Figure 2. The ministries of Finance and Rural Development have more instances of over-spending in their overall spending, while these are ministries which have estimated procurement under-spend.


Figure 3: Total spending gap (%) by ministry, 2014-15 to 2018-19


Alternative explanations

Underspend can be driven by other compulsions also. In a public choice theory worldview, state organisations would give the highest priority to wage and pension expenditures, and sacrifice procurement expenditures when faced with formal or informal budget constraints. This makes procurement budgets the most vulnerable to sudden cuts.

However, this argument should apply equally across all ministries. In fact, the ministries which do higher amounts of procurement should be the prime target for mid-year budget cuts. This argument predicts that under-spend should take place roughly everywhere, and maybe to a greater extent in the high-procurement ministries. The evidence, however, shows that under-spend is more prevalent in low-procurement ministries.

Discussion

The main finding of this article is that ministries that tend to procure consistently, tend to have smaller procurement spending gaps. This is consistent with the idea that there is learning by doing, where doing procurement on a sustained basis gradually creates organisational capability for procurement.

If the key claim of this article is true -- that there is learning by doing in procurement -- this has a few interesting implications. In a department where there is low experience with procurement, the early years where procurement work begins will work poorly. In such a department, procurement under-spend is likely, with consequential failures in public expenditure programs and budgeting. In a department with low experience with procurement, a sudden jump in the procurement budget is likely to be associated with failure to spend. If the political leadership decides to push up the procurement spend of a department by three times, it would make sense to (a) increase the budget by only 20% and (b) initiate a capacity building program for procurement capability within that department.

Procurement is an expertise. No government organisation can sporadically do this well. It is an expertise which can be built, albeit over many years. In any government organisation, people and processes can be organised to focus on this expertise, and to devote time and effort on the entire pipeline of government contracting. The process of developing this capability can be accelerated by bringing in people with this specialised expertise. Strengthening the entire life cycle is required to successfully spend budget amounts. But this is only the beginning of success in procurement where government can contract to deliver quality projects efficiently, on time and at low cost.

References

Aneesha Chitgupi and Susan Thomas. The make vs. buy decision of the union government, The Leap Blog. September 10, 2022.

Vijay Kelkar and Ajay Shah. In service of the republic: The art and science of public policy. Second edition, 2022.

Shubho Roy and Anjali Sharma. What ails public procurement: an analysis of tender modifications in the pre-award process, The Leap Blog, November 26, 2020.

Anjali Sharma and Susan Thomas. The footprint of union government procurement in India, XKDR Working Paper 10, November 2021.


Aneesha Chitgupi is a Research Fellow at XKDR Forum, Abhishek Gorsi is a doctoral candidate at the IGIDR and Susan Thomas is a Senior Research Fellowe at XKDR Forum and a Research Professor of Business at Jindal Global University. We thank Josh Felman, Sudha Krishnan, Ajay Shah and Anjali Sharma for feedback and comments.

Sunday, September 18, 2022

The make vs. buy decision of the union government

by Aneesha Chitgupi and Susan Thomas.

Introduction

Like every organisation, the government faces the question of make vs. buy in carrying out its functions. Should it recruit people, and take on management responsibilities of directly making goods/services? Should it enter into contracts with private persons who already specialise in this production? Each choice has a different cost when using public funds. Managers in government face a Markup in State Production, which is the inefficiency of the state in direct production, and the state has to deal with a Markup in State Contracting, which is its inefficiency when contracting for procurement (Kelkar and Shah, 2022).

This question needs to be set in some basic facts. How large are the magnitudes of make vs. buy in the Indian state? Over the years, is there a bias towards producing goods/services in-house? Is there a process of growing maturation where the buy ratio is going up, or have the spate of difficulties in government contracting of the recent decade led to a certain retreat from buy in favour of make? In this article, we collect evidence for the union government, to offer some answers to these questions.

Methodology and data constraints

We use the methodology in Sharma and Thomas (2021) to estimate what the Union Government spends on procurement in a year. This uses the annual statement of accounts (Accounts at a glance) published by Controller General of Accounts (CGA). The books of accounts of government follows cash based system, recording only cash transactions (as opposed to accrual based system where transactions are recorded upon becoming payable).

The calculation of what was spent on procurement uses the expenditure under various ``object heads''. This is only feasible from 2015-16 onwards, when the CGA started disclosing expenditure under object heads in their annual reports. In the work presented here, we undertake this measurement from 2015-16 upto 2019-20. We ensure comparability by converting nominal values to real using the CPI.

Our calculations differ from the methodology employed by Sharma and Thomas (2021) on three counts:

  1. We only report the procurement expenditure of the Union Government, which includes only the expenditure under its ministries. We do not include expenditure in Central Public Sector Enterprises (CPSEs), which accounted for 3.5x the procurement of the entire Union Government.
  2. We calculate procurement expenditure for the Railways Ministry using a combination of its annual reports and the capital expenditure reported in the CGA annual reports for the Ministry.
  3. We include only those items that can be unambiguously classified as procurement for the Union Government.

Results

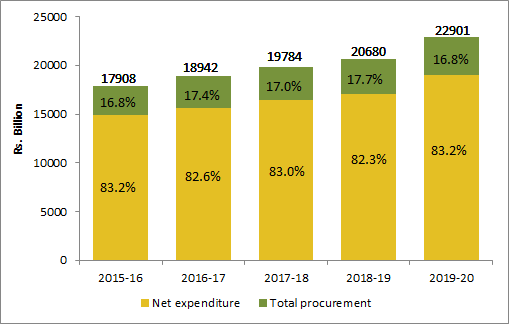
Figure 1 shows the real actual spending of the Union Government for 2015-16 to 2019-20. The fraction of procurement spending has been quite stable at around 17-18 percent of the total expenditure. The remaining 82-83 percent of budget each year is spent on salaries and pensions and payments in the form of Grants-in-Aid, which are about 20-25 percent of the budget each year.


Figure 1: Union Government spending, with fraction of total procurement, inflation adjusted, 2015-2019


Figure 2: Union Government procurement expenditure, with fractions of capital and revenue, inflation adjusted, 2015-2019   

Source for both figures: Annual statement of accounts by CGA, Annual report of the Indian Railways, and authors' calculation.

While the share of procurement within total expenditure has been stable, there is a small shift in the composition of Union Government procurement. In Figure 2, we see that share of capital in total procurement increased from 53.7 percent to 57.5 percent between 2015-16 to 2019-20.

Table 1: Changes in share of total and procurement expenditure of Union Government as GDP (in %), 2015-2019


Total expenditure Procurement expenditure Capital procurement

/ GDP / GDP / GDP
2015-16 14.36 2.42 1.30
2016-17 14.37 2.50 1.38
2017-18 13.92 2.37 1.31
2018-19 13.55 2.40 1.39
2019-20 14.23 2.39 1.37

Source: Annual statement of accounts by CGA, annual reports of Indian Railways and authors' calculation.

How have these changed as a share of overall GDP? Table 1 shows that these fractions tend to be stable, whether it is the total spending by govt, or the spending on procurement or on capital procurement spending. There are some changes during 2017-18. This is likely a result of lack of maneuverability to reduce revenue expenditure, and an emphasis on items such as subsidies (RBI, 2020).

Discussion

Government contracting is a critical part of state capacity that influences how the government chooses between make or buy in providing public goods. Given the more intractable problems faced by the Indian state in its attempts at recruiting people and producing internally, the possibility of contracting out to private firms is appealing. In the best examples, capabilities in public procurement have fostered innovation. But, this requires state capacity in government contracting. The evidence in India points to weak capacity in government contracting. Whether it is high levels of public litigation at courts (Mehta and Thomas, 2022; Damle et al, 2021), increasing levels of delayed payments at PSEs to vendors (Manivannan and Zaveri-Shah, 2019) and delays in project completion (Burman and Manivannan, 2022). Private parties are increasingly withdrawing from contracting with state (Mehta and Uday, 2021). This hampers purchase by the state as there is an inferior landscape of potential sellers.

A strategy of procurement reform could potentially put the Indian state on a path to higher capacity. The foundations of the field, of procurement reforms, lies in establishing basic facts:

  1. How large are the magnitudes of make vs. buy in the Indian state? About 17% of the expenses of the union government work through buy, the remainder work through make.

  2. Is the buy ratio something that is stable or does it fluctuate from year to year? The buy ratio is remarkably stable; it changes very little from year to year.

  3. Is there a process of growing maturation where the buy ratio is going up? Or alternatively, have the spate of difficulties in government contracting of the recent decade led to a certain retreat from buy in favour of make? The buy ratio is highly stable; it shows no time trend. What has changed is a small shift towards a increasing spending for capital procurement.

This shows that, in real terms, the allocation between the make vs. buy choice of the union government has remained the same. But there has been a rise in the share of capital procurement spending. This tends to involve spending in projects with longer maturity, with greater risks to the project during the contract implementation and management phase being the underlying driver for procurement failure. Bottlenecks to resolving problems in this stage of procurement will become an important area to focus on as the government reforms public procurement rules and processes.

References

Vijay Kelkar and Ajay Shah. In service of the republic: The art and science of public policy. Second edition, 2022, forthcoming.

Pavithra Manivannan and Bhargavi Zaveri. How large is the payment delays problem in Indian public procurement?. The Leap Blog. 22 March 2021.

Charmi Mehta and Susan Thomas. Identifying roadblocks in highway contracting: lessons from NHAI litigation. The Leap Blog. 13 July 2022.

Devendra Damle, Karan Gulati, Anjali Sharma and Bhargavi Zaveri. Litigation in public contract: some estimates from court data. The Leap Blog. 26 May 2021.

Pavithra Manivannan and Bhargavi Zaveri. How large is the payment delays problem in Indian public procurement?. The Leap Blog. 29 March 2022.

Perun. Defence economics, and the U.S. production advantage, YouTube, 31 July 2022.

Charmi Mehta and Diya Uday. How competitive is bidding in infrastructure public procurement? A study of road and water projects in five Indian states. The Leap Blog. 22 March 2021.

Anirudh Burman and Pavithra Manivannan. Timeliness in government contracting: Evidence from the country's largest metro-rail network. The Leap Blog. 12 August 2022.

Anjali Sharma and Susan Thomas. The footprint of union government procurement in India. XKDR Working Paper 10, November 2021.


Aneesha Chitgupi is a Research Fellow at XKDR Forum, and Susan Thomas is a Researcher at XKDR Forum. We thank Abhishek Gorsi for excellent research assistance, Josh Felman, Sudha Krishnan, Anjali Sharma and Ajay Shah for their inputs and comments.