by Ila Patnaik, Josh Felman, Ajay Shah.
Changes in the exchange rate are very visible. But is the apparent change in the exchange rate a fair depiction of the pressure on the currency market? As an example, consider China's story with the exchange rate:
The upper panel is monthly returns on the CNY/USD. Positive returns are depreciations and vice versa. We see large periods of zero change separated by a few months in which there was an appreciation. Does this mean that in the long periods of zero change in the exchange rate, the currency market was quiescent? No. This is a period in which the Chinese central bank was trading in the currency market on a large scale. As the graph of their foreign exchange reserves shows, they went from \$0.4T in 2004 to \$1.9T in 2009. There was a lot of pressure on the currency to appreciate. What we see, as zero or small negative returns, understates the true story.
In order to address this problem, economists aspire to construct a measure of `exchange market pressure' (EMP), which would show the true conditions on the currency market in each month. To borrow a phrase from Amit Varma's podcast, there's an important difference here between the seen and the unseen. The apparent exchange rate change is what we see. What's really going on, in terms of the macroeconomic situation on the currency market, is the exchange rate pressure.
Attempts at EMP measurement have been in progress since Girton and Roper, 1977. There are many EMP measures in the literature. An important one, which expresses the mainstream strategy, is by Eichengreen et. al., 1996 . They propose an EMP index for a country is given by:
\[
\textrm{EMP}_{t} = \frac{1}{\sigma_{e}} \frac{\Delta e_{t}}{e_{t}} - \frac{1}{\sigma_{\bar r}} \left ( \frac{\Delta \bar r_{t}}{\bar r_{t}} - \frac{\Delta \bar r_{US_t}}{\bar r_{US_t}} \right) + \frac{1}{\sigma_i} \left (\Delta \left (i_{t} - i_{US_t} \right) \right)
\]
Where the exchange rate is denoted by $e_t$, reserves divided by base money is $\bar r_t$ and intervention of the central bank at time $t$ is $i_t$. The change in $e_t$ is denoted by $\Delta e_t$; the change in $\frac{r_t}{m_0}$ is denoted by $\Delta \bar r_t$. The three sigmas, $\sigma_e$, $\sigma_{\bar r_t}$, and $\sigma_i$, denote the standard deviations of the relative change in the exchange rate, difference between relative changes in the ratio of foreign reserves and base money in the home country against the reference country (US), and the nominal interest rate differential.
This EMP measure is essentially a weighted average of changes in exchange rate, foreign exchange reserves, and interest rates. To prevent the most volatile component of the index from dominating (usually the forex reserves), each component is weighted by its standard deviations. The resulting EMP index is dimensionless. There is a literature (Pentecost et. al., 2001, IMF.,2007) which finds that these kinds of measures are useful in forecasting currency crises.
This approach to measurement has several problems. When there is a fixed exchange rate, the standard deviation in the denominator goes to zero. When a country with an inflexible rate (low $\sigma_e$) experiences a modest change in the exchange rate, this shows up as a large value of EMP. As an example, consider the Chinese experience in the time period covered in Figure 1:
In some months, it is not possible to compute the EMP as we get a divide by zero. In other months also, the graph above does not square with our understanding of what was going on. As an example, consider the period after the Lehman collapse. The EMP measure seems to suggest that this is where the highest pressure to appreciate was seen, which seems incorrect.
A recent paper, Patnaik et al., 2017 introduces a new method for measurement of EMP. This new approach seeks to measure EMP in the units of percentage change of the exchange rate of the month. The EMP reported for a month is an estimate of the unseen - the exchange rate change (measured in per cent) which would have taken place if there had been no currency intervention in that month.
Let's treat this new method as a black box and examine how well it works.
The figure above juxtaposes the conventional EMP measure against the new proposed measure.
There are two gray blocks in the conventional measure, where EMP can't be computed as it was a fixed exchange rate and we encounter the divide by zero. The new measure has no such problem.
In the long period of pressure to appreciate, the new measure shows an interpretable value such as a 5% appreciation in the month, which would have taken place if there had been no trading by the central bank in the currency market. The conventional EMP index is dimensionless and cannot be interpreted in similar fashion.
At the Lehman crisis, the new measure shows a sudden shift in exchange market pressure, followed by a return to the pressure to appreciate. The conventional measure suggests the highest ever pressure to appreciate was found at the time of the Lehman crisis, and this pressure subsided later.
For macroeconomists who know the Indian experience closely, the new measure makes a lot of sense.
In early 2007, it is rumoured that RBI was purchasing as much as \$1B a day, and there was very high pressure to appreciate prior to the structural break in the exchange rate regime on 23 March 2007. This shows up correctly in the new measure. The conventional measure, in contrast, thinks there was not much going on then.
The conventional measure seems to say that at the Lehman crisis, there was a switch from depreciation pressure to appreciation pressure. This seems unlikely. The new measure shows the highest-ever pressure to depreciate right after the Lehman crisis. This seems correct.
There was a long period (2002-2008) with one-way pressure to appreciate. This is picked up in the new measure but not in the conventional measure.
The Russian invasion of Georgia (08/08/08), followed by the Lehman shock in the next month, are associated with an immediate shift to depreciation pressure in the new measure (from August itself, reflecting the Georgia invasion). The conventional measure does not pick up these events correctly.
The Russian invasion of Crimia is followed by pressure to depreciate, in the new measure. This does not appear as clear in the conventional measure.
The Lehman failure, and the Taper tantrum, show up as episodes of pressure to depreciate in the new measure but not in the conventional measure.
Exchange market pressure is an important tool for better understanding macroeconomics. While the concept has always been attractive, conventional methods for measurement have had limitations. The new measure makes it possible to take interest in EMP as a tool for macroeconomic analysis. This article aims to unveil the new measure as a black box, to show that it works better than the conventional measure. The methodology is presented in the underlying paper. The resulting dataset, with monthly EMP data for 139 countries, has been released, and has diverse potential research applications.
Eichengreen, B., Rose, A., Wyplosz, C., 1996. Contagious Currency Crises , Technical Report. National Bureau of Economic Research.
Patnaik, I., Felman, J. and Shah, A., 2017. An exchange market pressure measure for cross country analysis . Journal of International Money and Finance, 73, pp.62-77.
Desai, M., Patnaik, I., Felman, J. and Shah, A., 2017. A cross-country Exchange Market Pressure (EMP) Dataset . Data in Brief.
Pentecost, E., Van Hooydonk, C., Van Poeck, A., 2001. Measuring and estimating exchange market pressure in the EU . J. Int. Money Finan. 20, 401¡V418.
IMF, 2007. Managing Large Capital Inflows , Technical Report. International Monetary Fund.
Exchange rates vs. exchange market pressure
Changes in the exchange rate are very visible. But is the apparent change in the exchange rate a fair depiction of the pressure on the currency market? As an example, consider China's story with the exchange rate:
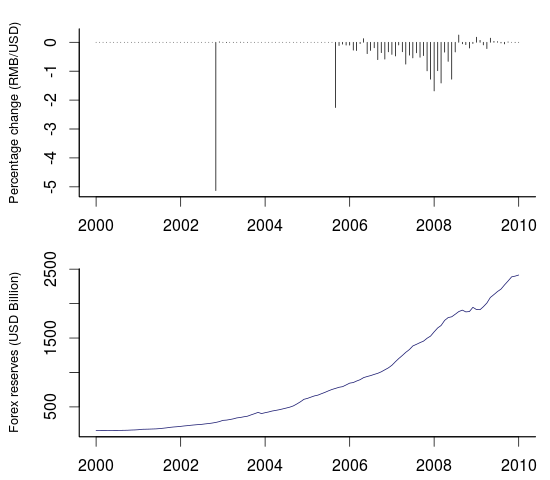 |
| Figure 1: China's monthly exchange rate returns (upper) and foreign exchange reserves (lower) |
The upper panel is monthly returns on the CNY/USD. Positive returns are depreciations and vice versa. We see large periods of zero change separated by a few months in which there was an appreciation. Does this mean that in the long periods of zero change in the exchange rate, the currency market was quiescent? No. This is a period in which the Chinese central bank was trading in the currency market on a large scale. As the graph of their foreign exchange reserves shows, they went from \$0.4T in 2004 to \$1.9T in 2009. There was a lot of pressure on the currency to appreciate. What we see, as zero or small negative returns, understates the true story.
In order to address this problem, economists aspire to construct a measure of `exchange market pressure' (EMP), which would show the true conditions on the currency market in each month. To borrow a phrase from Amit Varma's podcast, there's an important difference here between the seen and the unseen. The apparent exchange rate change is what we see. What's really going on, in terms of the macroeconomic situation on the currency market, is the exchange rate pressure.
Conventional thinking in EMP measurement
Attempts at EMP measurement have been in progress since Girton and Roper, 1977. There are many EMP measures in the literature. An important one, which expresses the mainstream strategy, is by Eichengreen et. al., 1996 . They propose an EMP index for a country is given by:
\[
\textrm{EMP}_{t} = \frac{1}{\sigma_{e}} \frac{\Delta e_{t}}{e_{t}} - \frac{1}{\sigma_{\bar r}} \left ( \frac{\Delta \bar r_{t}}{\bar r_{t}} - \frac{\Delta \bar r_{US_t}}{\bar r_{US_t}} \right) + \frac{1}{\sigma_i} \left (\Delta \left (i_{t} - i_{US_t} \right) \right)
\]
Where the exchange rate is denoted by $e_t$, reserves divided by base money is $\bar r_t$ and intervention of the central bank at time $t$ is $i_t$. The change in $e_t$ is denoted by $\Delta e_t$; the change in $\frac{r_t}{m_0}$ is denoted by $\Delta \bar r_t$. The three sigmas, $\sigma_e$, $\sigma_{\bar r_t}$, and $\sigma_i$, denote the standard deviations of the relative change in the exchange rate, difference between relative changes in the ratio of foreign reserves and base money in the home country against the reference country (US), and the nominal interest rate differential.
This EMP measure is essentially a weighted average of changes in exchange rate, foreign exchange reserves, and interest rates. To prevent the most volatile component of the index from dominating (usually the forex reserves), each component is weighted by its standard deviations. The resulting EMP index is dimensionless. There is a literature (Pentecost et. al., 2001, IMF.,2007) which finds that these kinds of measures are useful in forecasting currency crises.
Problems with conventional EMP measurement
This approach to measurement has several problems. When there is a fixed exchange rate, the standard deviation in the denominator goes to zero. When a country with an inflexible rate (low $\sigma_e$) experiences a modest change in the exchange rate, this shows up as a large value of EMP. As an example, consider the Chinese experience in the time period covered in Figure 1:
 |
| Figure 2: Conventional EMP measure for China |
In some months, it is not possible to compute the EMP as we get a divide by zero. In other months also, the graph above does not square with our understanding of what was going on. As an example, consider the period after the Lehman collapse. The EMP measure seems to suggest that this is where the highest pressure to appreciate was seen, which seems incorrect.
A better EMP measure
A recent paper, Patnaik et al., 2017 introduces a new method for measurement of EMP. This new approach seeks to measure EMP in the units of percentage change of the exchange rate of the month. The EMP reported for a month is an estimate of the unseen - the exchange rate change (measured in per cent) which would have taken place if there had been no currency intervention in that month.
Let's treat this new method as a black box and examine how well it works.
Example: EMP in China
 |
| Figure 3: Conventional vs. new EMP measures for China |
The figure above juxtaposes the conventional EMP measure against the new proposed measure.
There are two gray blocks in the conventional measure, where EMP can't be computed as it was a fixed exchange rate and we encounter the divide by zero. The new measure has no such problem.
In the long period of pressure to appreciate, the new measure shows an interpretable value such as a 5% appreciation in the month, which would have taken place if there had been no trading by the central bank in the currency market. The conventional EMP index is dimensionless and cannot be interpreted in similar fashion.
At the Lehman crisis, the new measure shows a sudden shift in exchange market pressure, followed by a return to the pressure to appreciate. The conventional measure suggests the highest ever pressure to appreciate was found at the time of the Lehman crisis, and this pressure subsided later.
Example: EMP in India
 |
| Figure 4: Conventional vs. new EMP measures for India |
For macroeconomists who know the Indian experience closely, the new measure makes a lot of sense.
In early 2007, it is rumoured that RBI was purchasing as much as \$1B a day, and there was very high pressure to appreciate prior to the structural break in the exchange rate regime on 23 March 2007. This shows up correctly in the new measure. The conventional measure, in contrast, thinks there was not much going on then.
The conventional measure seems to say that at the Lehman crisis, there was a switch from depreciation pressure to appreciation pressure. This seems unlikely. The new measure shows the highest-ever pressure to depreciate right after the Lehman crisis. This seems correct.
Example: EMP in Russia
 |
| Figure 5: Conventional vs. new EMP measures for Russia |
There was a long period (2002-2008) with one-way pressure to appreciate. This is picked up in the new measure but not in the conventional measure.
The Russian invasion of Georgia (08/08/08), followed by the Lehman shock in the next month, are associated with an immediate shift to depreciation pressure in the new measure (from August itself, reflecting the Georgia invasion). The conventional measure does not pick up these events correctly.
The Russian invasion of Crimia is followed by pressure to depreciate, in the new measure. This does not appear as clear in the conventional measure.
Example: EMP in Brazil
 |
| Figure 6: Conventional vs. new EMP measures for Brazil |
The Lehman failure, and the Taper tantrum, show up as episodes of pressure to depreciate in the new measure but not in the conventional measure.
Conclusion
Exchange market pressure is an important tool for better understanding macroeconomics. While the concept has always been attractive, conventional methods for measurement have had limitations. The new measure makes it possible to take interest in EMP as a tool for macroeconomic analysis. This article aims to unveil the new measure as a black box, to show that it works better than the conventional measure. The methodology is presented in the underlying paper. The resulting dataset, with monthly EMP data for 139 countries, has been released, and has diverse potential research applications.
Bibliography
Eichengreen, B., Rose, A., Wyplosz, C., 1996. Contagious Currency Crises , Technical Report. National Bureau of Economic Research.
Patnaik, I., Felman, J. and Shah, A., 2017. An exchange market pressure measure for cross country analysis . Journal of International Money and Finance, 73, pp.62-77.
Desai, M., Patnaik, I., Felman, J. and Shah, A., 2017. A cross-country Exchange Market Pressure (EMP) Dataset . Data in Brief.
Pentecost, E., Van Hooydonk, C., Van Poeck, A., 2001. Measuring and estimating exchange market pressure in the EU . J. Int. Money Finan. 20, 401¡V418.
IMF, 2007. Managing Large Capital Inflows , Technical Report. International Monetary Fund.
Can this concept be adapted to measure stock price pressure ?
ReplyDelete