Search interesting materials

Showing posts with label finance. Show all posts

Wednesday, November 18, 2026

Financing Better Public Parks in Indian Cities

by Anirudh Burman.

Why urban parks present a public-finance problem

Parks provide places to walk, play and meet, while their trees and open spaces offer benefits beyond those who visit them. Keeping parks accessible requires continuing expenditure on gardeners, cleaning, water, repairs and the replacement of worn-out facilities. Municipal budgets must meet these costs alongside other infrastructure needs. Charging visitors can raise money, but may discourage use and exclude residents who cannot afford to pay.

Indian cities have already sought support through park adoption, donated facilities and commercial uses. They also pay contractors and community organisations to undertake maintenance. These arrangements perform different financial functions. Outsourcing changes who delivers a publicly funded service; mobilising private finance brings additional contributions towards improvements or upkeep. A donated facility or permission to operate a kiosk, however, does not by itself ensure that money will be available for continuing care.

I argue that public finance should help mobilise private resources through commitments that contributors, park managers and public authorities can honour. Contributors need defined benefits and clarity about their obligations. Managers need dependable funding, sufficient continuity and authority to use the receipts on which their maintenance plans depend. Public authorities must preserve access and provide for parks with limited prospects of attracting donations or commercial income. The objective is to increase the resources available for accessible, well-maintained parks while retaining a dependable public commitment to their care.

The essay develops this argument through comparisons with New York and London's Royal Parks and an examination of arrangements in Indian cities. It considers operating funding, tenure, donor benefits, revenue rights and public safeguards to explain how private contributions can support continuing maintenance. The comparison leads to principles for public finance suited to parks with different costs, donor bases and commercial opportunities.

Principles for a financing architecture

First, I consider the option of free access. The case for public expenditure is straightforward. General revenues can flatten costs and benefits across those who do and do not use parks directly. Where available money falls short of the cost of acceptable care, the authority must increase funding or reduce service standards.

The other usual option is ticketed entry. Charges can contribute to upkeep where visitors are willing and able to pay. However, charging for every visit may discourage regular use and exclude poorer residents, and also leave wider environmental benefits unpaid.

A third option is to combine public and private financing. The city can fund basic maintenance while donors/ licensees of services pay for improvements or contribute to annual upkeep. Companies can support eligible work through corporate social responsibility (CSR) programmes. A licensed cafe can pay fees towards maintenance where commercial demand permits. Public ownership and free entry can continue. The Delhi Urban Art Commission's Park Design Guidelines already discusses such contributions and revenue sources.

This mix addresses the limits of the first two options. In Indian cities, public finances are often inadequate to fund park maintenance alongside competing infrastructure needs. Research on Chennai describes a municipal corporation with few internal resources and neglected parks in poorer neighbourhoods. Ticketing cannot reliably fill this gap. Affordable charges may raise too little, while higher charges exclude users and discourage visits. Where sufficient revenue depends on prices that residents cannot afford, ticketing is infeasible as the main source of maintenance funding.

A workable funding arrangement must meet two requirements. It must provide capital resources to rehabilitate a park and recurring resources to keep it in good condition. Capital resources pay for works such as repairing paths, installing toilets or replacing playground equipment.

Recurring resources must cover gardeners' wages, cleaning, water, electricity and repairs, with provision for eventual replacement of worn-out assets. A donated toilet illustrates the distinction. Its construction may be fully financed, while there may not be any plan or provision for its cleaning, water supply and repairs. This is a general phenomenon observed in Indian city infrastructure in general, and also in parks.

New York and London's Royal Parks illustrate how public payments, donations and commercial income can be combined to meet both requirements.

What New York and London demonstrate

The international and Indian cases were selected to show variation in financing arrangements and governance, not to represent all Indian parks or support a statistical comparison. The essay compares how these arrangements work on paper and in reported practice; it does not rank their performance.

New York

New York combines public ownership of parks with several forms of management. The city's parks department, NYC Parks, provides services directly and contracts with nonprofit organisations for specified responsibilities. The mayor and budget office prepare spending plans, and the City Council approves public expenditure. Nonprofit boards manage their own staff, budgets, fundraising and investments. Commercial concessions require separate public approvals, including review by the city's Franchise and Concession Review Committee where applicable. State law also protects parkland against diversion to non-park uses, generally requiring specific legislative authorisation. Delegating maintenance therefore leaves important decisions over money and land with public authorities.

The Central Park Conservancy which manages the Central Park is one such nonprofit. Formed in 1980, it developed from civic fundraising and restoration into a professional management organisation, with a formal city management agreement from 1998. It employs staff, maintains the park and plans improvements within its delegated role. The city retains ownership and regulatory authority. This continuing relationship enables the Conservancy to accept gifts and undertake obligations extending beyond individual restoration projects.

The city also pays the Conservancy for services. Termination is limited to specified contractual conditions. The Conservancy must raise and spend at least \$16 million annually on specified services. In exchange, the city pays \$16 million a year, reducible in proportion to cuts in the city's operating budget. This payment sits alongside private fundraising and separate public capital projects. It gives the organisation a defined public contribution against which to plan, while leaving it exposed to fundraising risk.

Within this institution, donors can support memberships, commemorative benches and trees, restoration projects or endowments. Recognition, experiences and negotiated project naming offer different reasons to give without conferring ownership or exclusive possession. The money has different uses. Unrestricted gifts can pay salaries and cleaning bills. Restricted gifts have to be used for their agreed purpose. Endowments invest donated capital and provide distributions under spending rules accompanied by a plan for subsequent care. Organised fundraising connects donors to a manager able to explain those obligations and account for their money.

New York's Bryant Park Corporation manages Bryant Park under city agreements, with concessions and business improvement district (BID) arrangements supplying revenue. Under New York's BID framework, a district management nonprofit spends compulsory property assessments on local services under an approved plan. Property owners, tenants and public officials are represented on its board, and the city collects and transfers the assessments. This gives nearby beneficiaries a collective financing arrangement. The assessment is distinct from a voluntary gift or a levy calculated on measured land-value appreciation.

Concessions give operators permission to earn money from specified activities in exchange for contractual payments or services. Public approval determines the permissible use and the how the receipts are allocated. A park manager cannot assume that permission to host a cafe includes permission to retain its income. Bryant Park's combination depends on commercial demand and the surrounding property economy.

These arrangements coexist with ordinary municipal maintenance. For neighbourhood parks, NYC Parks continues to provide core services, supplemented by local fundraising and volunteering. Partnerships for Parks, operated with City Parks Foundation, helps community groups organise, access grants and administer funds through fiscal sponsorship. Groups can therefore share administrative support without establishing a professional conservancy for every park.

London

London's eight Royal Parks, including Hyde Park and Richmond Park, form a Crown estate under the central government's Department for Culture, Media and Sport (DCMS), separate from ordinary municipal parks. A 2016 contracting-out order allowed DCMS to delegate its statutory management functions. In 2017, the functions of the government parks agency and a separate fundraising foundation were combined in a charitable company, The Royal Parks Limited. DCMS granted it a ten-year management licence and service contract. The charity manages the estate but cannot sell the parks. The reform addressed restrictions that had prevented the agency from accumulating reserves and retaining surplus receipts across years. Combining management and fundraising with these financial powers allowed the charity to plan beyond the annual budget cycle.

DCMS holds the public management powers and permits the charity to retain park income. Trustees approve budgets, staffing, investment, reserves and commercial strategy within the licence and charitable obligations. The senior managers handle daily operations within delegated financial limits. The Mayor of London appoints some trustees and has adjacent planning responsibilities, but neither general ownership nor annual budget responsibility. Regulators oversee compliance and auditors examine the accounts, while operational decisions remain with the charity.

The charity's wholly owned trading subsidiary conducts commercial activities and transfers available profits to the charity. Concession and event partners operate under approved contracts, park-use restrictions and relevant planning, conservation and safety requirements. Revenue retention allows the charity to keep authorised receipts and spend them on the parks. Carry-forward and reserves let it meet costs in later years. Managing the portfolio together also allows shared administration and planning across parks with different earning opportunities.

This structure supports a predominantly earned-income model. In 2024-25, trading activities generated about GBP 46.3 million, including events, catering concessions, property income, parking and filming. DCMS paid an GBP 11 million cash service fee, which did not meet the full cost of management. Donations and grants contributed about GBP 3 million. Other income included sporting and cultural activities. It supplied no cash for wages. Commercial receipts, philanthropy and the government payment therefore make different contributions to the operating budget.

The contract also allocates risk. The charity bears ordinary operating and asset-maintenance risk, while DCMS retains major asset-failure risk. Events income fell in 2024-25, showing why commercial receipts require a financial buffer. The trustees set general reserves at GBP 23 million, including GBP 15 million for working capital to meet current bills, while separately designating funds for restoration and maintenance projects.

This comparison explains five factors: operating funding, tenure, donor benefits, revenue rights and public safeguards. New York's contracts and district arrangements, and London's licence and delegated powers, identify governance and accountability structures allowing for autonomy and diversification. They allow park managing organisations to hire staff, seek gifts and manage receipts while government retains control over public assets. Exceptional donor wealth, property values and visitor demand limit their transferability.

Indian cities already use multiple financing arrangements

Indian cities have also tried to combine public expenditure with community participation, donated facilities and commercial activity. The public bodies responsible for these arrangements differ across cities and sometimes within the same city. Their control over land, maintenance budgets and permissions determines what they can offer a contributor. The existing arrangements show both how public money supports delegated maintenance and how cities seek additional private resources.

Delhi

Delhi has separate arrangements for parks controlled by the Delhi Development Authority (DDA) and the Municipal Corporation of Delhi (MCD). DDA owns the parks offered for adoption, and its horticulture officers sign the agreements and supervise the adopters. MCD maintains municipal parks through its horticulture department and other service providers. A third institution, the Delhi Parks and Gardens Society (DPGS), administers government grants to residents' welfare associations (RWAs) and nongovernmental organisations. A community group using a DPGS grant spends public money, whereas a DDA adopter finances the agreed work from its own resources.

DPGS provides separate grants for routine maintenance, new parks and decentralised sewage-treatment plants. The application process requires permission from the land-owning agency, a tripartite agreement, inspections and utilisation certificates documenting expenditure. Residents organise the work using public grant money. Additional contributions from residents supplement that public funding.

MCD's Standing Committee approved the revival of its stalled RWA scheme in February 2026. The revival followed an earlier interruption and reports of unpaid dues. Under the scheme, the commissioner must approve each adoption, and horticulture staff are responsible for monitoring the work. Under the reported terms, MCD would pay RWAs INR 13,500 per acre each month for gardening, irrigation, mowing and cleaning. MCD retains responsibility for existing lights, gyms, shelters and play equipment. RWAs cannot undertake permanent construction or commercial activities. The arrangement separates routine care from municipal infrastructure obligations, without giving associations a commercial income stream.

DDA's adoption policy (2020), instead, requires adopters to meet the full cost of agreed improvements and maintenance. Adopters can upgrade and maintain a park, maintain an existing park or part of one, or install and maintain a facility. DDA approves improvements and retains control over the park, while adopters must preserve public access, meet prescribed maintenance standards and submit to inspection. The initial three-year term can be renewed with DDA approval in three-year periods up to twelve years, subject to the park remaining under DDA. DDA permits acknowledgement signs and approved public events for up to twenty days a year. The policy contemplates temporary kiosks but does not automatically entitle adopters to retain the receipts. Installed assets vest in DDA when the arrangement ends.

Mumbai

For Mumbai's municipal parks, the Brihanmumbai Municipal Corporation (BMC) provides funding through its Garden Department and procures maintenance through ward-level contracts. BMC's 2025-26 budget proposed INR 220.12 crore for the department as a whole. The budget also recorded an invitation for volunteer agencies to participate in the proposed Mumbai Public Park without a financial commitment from BMC. The volunteer invitation sought contributions from outside the municipal budget.

BMC has also experimented with adoption and caretaker arrangements. However, this move was derailed due to objections. Public controversy centred on the mingling of private facilities, possession of parkland by the adopters and caretakers, and restrictions on access. A February 2024 report described BMC's withdrawal of a draft offering longer adoption terms after public objections. This history helps explain why the permissions offered to private participants have remained contested.

Kolkata

The Kolkata Municipal Corporation (KMC) provides municipal park services through its Parks and Squares Department. KMC's budget combines parks, squares and urban forestation in one expenditure head. The corporation's published account of its park services identifies maintenance by a private horticultural company at Citizen's Park, or Mohar Kunja.

Commercial use has also occurred without a clear connection to maintenance funding. A report on Vivekananda Park described rentals by clubs, damaged paths, waste and restrictions on public use. It is unclear whther rental receipts accrued to the KMC or paid for upkeep. The Vivekananda Park example illustrates why permission to use public space, revenue collection and maintenance responsibility must be identified separately.

Bengaluru

Responsibility for Bengaluru's parks is divided among the municipal government, the Bangalore Development Authority (BDA) and the state Horticulture Department. The Bruhat Bengaluru Mahanagara Palike (BBMP) published a 2024 community-involvement policy for parks under municipal custody. The policy excludes Lalbagh, Cubbon Park and BDA parks. BBMP's 2024-25 performance report records contracted maintenance and Hasiru Mitra inspections, alongside separate provision for upgrades, fencing and new parks.

Under the community policy, companies, RWAs and other contributors can provide facilities and services such as benches, toilets, drinking water, cleaning and security. Contributors must obtain approval and enter into an agreement with BBMP. The municipality retains custody of the parks and supervises the work, while completed assets vest in the city. The policy specifies an eleven-month term and prohibits the direct acceptance of cash under this arrangement. BBMP separately reported 48 adopted parks and medians but did not report the value of adopters' contributions. Formal commencement of the policy and its application after municipal reorganisation remain unconfirmed. The published terms cannot therefore be assumed to govern all reported adoptions.

Chennai

The Greater Chennai Corporation (GCC) organises municipal park maintenance through its own labour force, contractors and adopters. Its City Action Plan records a snapshot of 702 parks: 76 maintained by GCC labour, 533 outsourced and 93 adopted. GCC pays contractors to undertake maintenance, while adoption can bring contributions from outside the municipal budget. These routes coexist within the corporation's portfolio, with different sources of funding and obligations.

GCC's 2023 proposals to improve contractor accountability included smaller maintenance packages and a payment structure with 75 per cent fixed and 25 per cent linked to inspections. A tender reported in December 2024 proposed a INR 46 crore maintenance package covering 595 parks over three years, with digital work logs, biometric attendance and user feedback. The proposals were intended to make work observable and connect public payments to contractors' performance. The tender and proposals do not establish whether monitoring subsequently produced deductions or better maintenance.

The Indian cases show that public agencies already use maintenance contracts, community grants and adoption to organise park care. Contracting and community grants rely on public funds, while adoption can require contributors to pay for both improvements and upkeep. Commercial use of park space raises separate questions about who receives the income and whether the receipts fund maintenance. Mumbai's caretaker disputes also show how private facilities and possession can create the perception, real or imagined, of threatenening public access. The next section compares Indian arrangements with those in New York and London on five grounds: operating funding, tenure, donor benefits, revenue rights and public safeguards. The comparison examines who can commit public funding, grant revenue rights and enforce maintenance and access obligations.

The successes and constraints of the current arrangements

New York and London show how public support can combine with other income to sustain park management. Central Park pairs city payments with organised fundraising. The Royal Parks charity receives a government payment and retains commercial income. Indian cities also use public contracts, community grants, adoption and contributed facilities. Accountability, clear service objectives and autonomy over authorised spending are relevant institutional conditions. Funding instruments, including maintenance contracts, adoption agreements, gifts and concessions, specify who contributes, what they receive and which obligations they assume. Day-to-day practices determine whether those commitments are fulfilled. A maintenance contract depends on timely payment and credible inspection; an adoption agreement depends on clear maintenance duties and follow-through when work falls short.

The five criteria follow from the need to finance both improvements and recurring maintenance while preserving public access. Operating funding identifies who pays wages, utilities and repairs, and who bears a shortfall. Tenure matters because the duration and renewal conditions affect whether a contributor can plan for the medium to long-term. A capital improvement may last much longer than the agreement under which it was installed.

Donor benefits matter because a contributor may value recognition, experiences or improvements to a public amenity. Revenue rights establish whether the park manager may collect, retain and spend income from permitted activities. A donor's willingness to give and an operator's ability to earn money require different arrangements. Public safeguards concern the controls needed to protect access, verify maintenance and recover control after a breach. The criteria therefore test whether the promised resources and rights can support continuing care while protecting the park's public use.

Table 1. Park financing and management: Central Park, the Royal Parks and DDA adoption

DimensionCentral ParkDDA adoptionRoyal Parks: authority
Operating fundingCity service payments alongside Conservancy fundraising.Adopter bears development and maintenance costs under the policy.DCMS pays a cash service fee; trustees budget retained income.
Tenure2023-2033 management agreement; further renewal requires agreement.Three years, renewable in three-year terms up to twelve, subject to DDA jurisdiction.DCMS licence began in March 2017 for ten years; later terms require confirmation.
Donor benefitsRecognition, experiences, memorials and negotiated project naming.Specified acknowledgement signs and conditional public-event permissions.Trustees manage fundraising within charitable and licence obligations.
Revenue rightsConcession income follows separate authorisations and agreements.Kiosk permission supplies no automatic right to retain proceeds.DCMS permits retention; trustees decide expenditure within the permitted purposes.
Public safeguardsCity ownership, public approvals and contractual service duties.DDA retains control, requires public access and provides termination and asset handback.Government retains public powers; managers implement use restrictions; regulators and auditors oversee compliance.

Central Park: 2024 audited disclosures and published donor arrangements. DDA: policy amended October 2020, not an evaluation of executed adoptions. Royal Parks: 2024-25 accounts and published governance disclosures.

Operating funding

Central Park's management agreement gives the park Conservancy a public service payment alongside its fundraising obligations. In contrast, DDA's adoption policy places the agreed improvement and maintenance costs on the adopter, without a comparable public payment. Both arrangements delegate work, but the adopter under DDA must secure funding for that work. The Royal Parks charity combines retained income with a government service fee. The charity bears ordinary maintenance risk, while DCMS retains major asset-failure risk. The allocation of costs therefore matters as much as the range of funding sources.

MCD's RWA scheme and Chennai's maintenance contracts involve public payment for services. Their financial credibility depends on whether the authority pays on time. MCD's earlier interruption of the RWA scheme documents this risk. Chennai's inspection-linked payment proposals address the other side of the contract: whether the supplier earns payment by delivering the required work. Both of these are however better described as outsourcing contracts rather than mobilising private revenues for supplementing private ones.

Tenure

The Central Park Conservancy and the Royal Parks charity both manage publicly owned parks under ten-year agreements. Central Park's agreement runs from 2023 to 2033. The Royal Parks charity received its ten-year licence in 2017; the available accounts leave its post-2027 terms unconfirmed. In both cases, the agreement gives the manager a period over which to organise staff, fundraising and maintenance, subject to contractual duties and public oversight.

DDA offers an initial three-year adoption, renewable in three-year periods up to twelve years while the park remains under its jurisdiction. Continuing for the full period therefore requires successive approvals. DDA can also terminate an adoption through the prescribed procedure, and installed assets vest in the authority on termination or expiry. BBMP's published text specifies an eleven-month term, although its implementation status remains unverified.

The difference concerns the period for which a contributor can rely on an agreed role. DDA's three-year renewal cycle requires more frequent decisions about continuation than the ten-year agreements used for Central Park and the Royal Parks. If a donor funds a facility whose upkeep extends beyond the current term, the donor and public authority must agree who will provide that care after expiry. Renewal conditions can protect the public against poor performance, but uncertainty about continuation can complicate long-term commitments.

Donor benefits

Central Park and the Royal Parks both offer donors recognition without transferring ownership or exclusive use of park facilities. Their bench programmes make the offer concrete through published donation amounts and dedication conditions. Central Park also offers memberships, tree memorials and negotiated project recognition. The Royal Parks' bench dedications depend on location, availability and approved inscriptions. The shared feature is a defined offer administered by the organisation responsible for the park, although the range of benefits differs.

DDA already offers acknowledgement signs and approved public-event permissions. BBMP's published policy also provides a route for contributors to supply facilities and services. However, a prospective donor may still need a specific offer linking the contribution sought, the duration of recognition and responsibility for subsequent repairs.

A defined offer lets a contributor assess what the gift will secure and lets the manager explain the associated care obligations. Indian cities could make those terms explicit without giving donors control over public space. The offer must also distinguish charitable giving, corporate sponsorship and commercial investment. An Indian company cannot assume that spending on publicity or employee-only activities qualifies as CSR expenditure. Recognition may help attract support, but neither a better catalogue nor a more generous benefit can guarantee demand where potential donors are scarce.

Revenue rights

In New York and London, public authorities specify the rights under which park managers receive and use commercial income. New York allocates concession rights and receipts through public approvals and separate agreements. The Royal Parks licence expressly permits the charity to retain park income, and trustees can hold reserves and spend across years. Both examples connect permitted commercial activity to a financial arrangement identifying who receives the money and how it may support the parks.

DDA's adoption policy contemplates temporary kiosks, but has no automatic entitlement to operate a concession or retain its proceeds. Kolkata's rental example leaves the recipient and use of receipts unclear. These gaps matter because a park manager cannot budget on the assumption that activity within the park will generate income available for its own bills. The agreement must identify who collects the receipts, what share reaches maintenance and which authority approves that use. The Indian examples establish permissions or rentals more clearly than a dependable flow of usable maintenance income.

Central Park uses restricted gifts and endowments with specified purposes and spending rules. The Royal Parks receives donations and grants alongside commercial income, and maintains reserves for future obligations. Although their funding mixes differ, both have an organisation able to hold money and apply it to park care beyond the year of receipt.

The Indian adoption arrangements described here provide a narrower route. BBMP's published scheme accepts assets and services but prohibits direct cash acceptance under that policy. DDA envisages adopter-funded work but under its scheme there is a risk that a donated facility may leave the authority with future repair bills unless continuing care is separately funded. Collecting cash gifts, investing them and using distributions for maintenance would require an authorised recipient and explicit financial rules.

Bryant Park adds a further source of revenue through compulsory district assessments collected under New York's BID framework. The reviewed Indian policies establish no equivalent park-specific assessment. Introducing one would require its own legal basis and district-governance arrangements, beyond an agreement with an individual donor or adopter.

Public safeguards

Mumbai's caretaker controversies concern control of public land and the risk of restricted access. New York and London retain public ownership and regulate commercial uses. DDA also specifies access, maintenance and handback obligations. The question is whether the responsible authority can inspect performance, require correction and recover control. Chennai's proposed monitoring tools and DDA's service standards do provide mechanisms for supervision. I am however, not able to provide data on enforcement.

Some caveats are necessary. Donor wealth and commercial demand help sustain New York and London parks, and cannot be manufactured by improving contract terms. The same business models do not work for all parks. Professional fundraising, accounts and supervision also have costs that may be difficult for a small park to bear. For some parks, shared support or ordinary municipal provision may be more suitable. Public finance must therefore support dependable care where private resources are scarce, while making payments, revenue rights and maintenance obligations credible where complementary finance is feasible.

What public finance should do

Parks need money for improvements and continuing care, while free access limits how much of that cost can be charged to users. New York and London combine public support with donations and commercial income through organisations authorised to manage those resources. Indian cities already use adoption, contributed facilities and commercial permissions alongside publicly financed maintenance. The comparison in section 5 identifies the terms that make these arrangements workable: dependable operating finance, sufficient continuity, defined contributor benefits, usable revenue rights and enforceable public safeguards.

The task is therefore to connect private contributions to maintenance obligations that public agencies and park managers can honour. Permission to adopt a park, install a facility or operate a kiosk leaves important financial questions unresolved. The contributor needs to know what it will receive and how long its role will continue; the manager needs money it can use for the work promised. The case for complementary finance depends on completing that agreement, while recognising that donor wealth and commercial demand will limit what different parks can raise.

If public finance can support such commitments, private resources could fund rehabilitation, improve facilities and sustain better horticulture, cleaning and repairs without charging for every visit. Continuing gifts or permitted commercial receipts could help meet annual bills, while invested funds and reserves could provide for future care. Public money could then support a larger or better-maintained stock of accessible parks than it could finance alone. Where additional income meets costs at commercially attractive parks, public resources could also support neighbourhoods with fewer donors. These gains depend on contributions reaching maintenance, covering their own administrative costs and preserving public use.

Outsourcing alone does not mobilise private revenue. When a municipality pays a contractor or an RWA to maintain a park, the money still comes from the public budget. Better procurement may improve service or reduce its cost, but a change in provider does not establish an additional source of finance. Mobilisation requires contributions from outside that budget, whether gifts, privately funded work or income from permitted commercial activities. Central Park illustrates how the two functions can coexist: the city purchases services from an organisation that also raises private money. Its public payment and its fundraising perform different financial roles.

Additional income available for recurring care

Public finance should help mobilise resources that can meet recurring bills. A large capital gift cannot pay a gardener unless its terms allow money to be used for wages. Likewise, a busy cafe contributes to upkeep only if the financial arrangement directs usable receipts to maintenance. Central Park's unrestricted gifts and London's retained income show why the permitted use of money matters. The relevant gain is the additional maintenance that private resources can finance after fundraising, administration and supervision costs, accounting also for any public spending or existing income they displace.

A dependable public contribution can make that financing arrangement more credible. It gives a manager a funded service commitment around which to seek supplementary gifts or commercial income. Public authorities must still support essential care where those receipts fall short. The division of risk matters here: London's charity bears ordinary maintenance risk, while DCMS retains major asset-failure risk. Asking a contributor to meet costs beyond its financial means can leave a park with unfunded obligations despite the apparent transfer of responsibility.

Capital contributions accompanied by continuing care

Public finance should mobilise both improvements and the resources needed to sustain them. A donated toilet brings cleaning, water and repair costs; a restored playground brings inspection and eventual replacement costs. The financial value of the gift depends partly on whether those obligations are covered. Central Park's endowments illustrate one way of supporting future work, while DDA's renewal terms and BBMP's published short term raise the question of who continues care after an agreement ends. Capital funding, recognition and maintenance commitments therefore need compatible durations. A long care commitment can coexist with public ownership and free basic access.

Contributions matched to what participants value

Public finance should enable different contributors to support parks on terms suited to their motives. A commemorative donor may value recognition and lasting care; a company may support eligible environmental work; a commercial operator needs a defined opportunity to earn revenue. Central Park and the Royal Parks make some donor offers concrete through published dedication terms. DDA's acknowledgement signs and event permissions provide an Indian starting point. The principle is to connect each contribution to a clear benefit and a funded public service, while keeping gifts, CSR, commercial sponsorship and concessions distinct. Public authorities must have the power to honour the recognition, income rights or payments they promise.

The ability to receive, manage and sustain contributions

Private finance also requires organisations capable of raising and using it. Central Park's professional Conservancy manages donor relationships and restricted funds alongside park operations. The Royal Parks charity can retain income and hold reserves across years. Public support for accounting, fundraising and supervision may therefore help sustain contributions beyond a single restoration campaign. For smaller parks, shared administration or fiscal sponsorship may be more affordable than a separate organisation. Effective practices can operate within existing institutions. More reliable payments, consistent inspection and clearer donor reporting can improve how existing arrangements function within their authorised powers. Experience with those practices may reveal constraints that justify later changes to delegated powers, financial rules or organisational form. Formal redesign is therefore one possible response to experience, and its value depends on whether it enables better practice at a justified cost.

Different financing models for different parks

Public finance should support different financing models for parks with different earning potential. Large destination parks with visitor demand may combine a public maintenance contribution with concession fees, event income and organised fundraising. Neighbourhood parks with a willing donor base may draw on recurring gifts or adopter-funded care alongside municipal services. Parks with little commercial demand or donor support will need predominantly public finance, whether maintenance is delivered directly or through contracts. For small parks, shared fundraising and accounting may cost less than separate organisations. Where lawful and compatible with donor restrictions, a multi-park arrangement could pool some income to support less commercially attractive sites. The choice must reflect each park's costs, earning potential and public uses. Public allocations should follow service needs, so a park's inability to attract donors does not become a reason for poorer care.

References

Jeet Mashru. 2023. "These Are Some of Our City's 'Parks'". Hindustan Times, 20 April. Opening budget paragraph and "Veer Abdul Hamid Maidan, Dharavi."

Sophiya Mathew. 2024. "Parks and (No) Recreation". The Indian Express, 19 July.

Kolkata Municipal Corporation. 2024-25. "Budget Estimates 2024-2025". Revenue-fund table, "Parks & Squares and Urban Forestation."

Delhi Urban Art Commission. 2020. "Park Design Guidelines". Printed pp. 65-72, sections 4.1-4.3.

Central Park Conservancy. 2024. "Financial Statements, June 30, 2024 and 2023". Note 11, printed p. 24 (PDF p. 25); fund and endowment disclosures.

Central Park Conservancy. n.d.. "Corporate Programme".

Central Park Conservancy. n.d.. "Adopt-A-Bench".

New York City Small Business Services. n.d.. "Business Improvement Districts". Sections on governance, funding and oversight.

The Royal Parks. 2024-25. "Annual Report and Accounts 2024-25". Pp. 65-67, 75-80 and 90-91; note 1(f).

Kolkata Municipal Corporation. n.d.. "Parks and Squares". "PPP Projects."

Tamil Nadu Pollution Control Board. 2021.. "Action Plan for Control of Air Pollution in Million Plus City of Tamilnadu (Revised): Chennai U. A.". Section 14.1, p. 65.

Government of NCT of Delhi. 2023-24. "Economic Survey of Delhi 2023-24". Pp. 165-166, sections 8.1-8.2.

Delhi Parks and Gardens Society. 2021. "Application for Financial Assistance". September; application and payment workflow.

Drishti Jain. 2026. "Municipal Corporation of Delhi Brings Back RWA Partnership to Maintain Parks amid Staff Shortage". The Indian Express, 24 February. Opening approval and arrears paragraphs; final infrastructure and land-use paragraphs.

The Times of India. 2025. "MCD to Reintroduce PPP Scheme for Park Maintenance in Delhi".

Bruhat Bengaluru Mahanagara Palike. 2024. "Community Involvement for Park Conservation Policy". Part I, sections 1-2; Part II, sections 1-4; MOU, sections 3-5.

Bruhat Bengaluru Mahanagara Palike. 2024-25. "Performance Report 2024-25". Pp. 29-30, paragraphs 28-33.

Sneha Priya Yanappa et al.. 2025. "A Park for All". Vidhi Centre for Legal Policy, September. Pp. 76-89 and 91-105.

Delhi Development Authority. 2019. "Adoption of Parks Policy 2019". Amended 9 October 2020. Sections 2, 5-10 and 11-13, pp. 3-9; model agreement, pp. 12-23.

The Telegraph. 2025. "KMC's Bid to Stop Renting Out Space Inside Park". January.

The New Indian Express. 2023. "GCC to End Practice of Single Contractor Maintaining Many Parks". 29 April.

The New Indian Express. 2024. "Greater Chennai Corporation Floats Bids for Upkeep of 595 Parks". 22 December.

Sayli Udas-Mankikar. 2020. "Formulating Open-Space Policies for India's Cities: The Case of Mumbai". ORF Occasional Paper 241, April. "Open Spaces Policy" and conclusion.

Linah Baliga. 2024. "BMC Scraps Draft Policy on Open Spaces". Hindustan Times, 12 February.

Jon Kher Kaw, Hyunji Lee and Sameh Wahba, eds.. 2020. "The Hidden Wealth of Cities: Creating, Financing, and Managing Public Spaces". World Bank. Chapter 3, pp. 55-93.

Manisha Anantharaman, Marlyne Sahakian and Czarina Saloma. 2023. "Spatialising Degrowth in Southern Cities: Everyday Park-Making for (Un)Commoning". Urban Studies 60(7), pp. 1266-1284.

Central Park Conservancy. n.d.. "Our Story".

House of Commons. 2016. "General Committee Proceedings". 19 October.

London Assembly. 2024. "London's Royal Parks". October.

Brihanmumbai Municipal Corporation. 2025. "Budget Estimates A, B & G, 2025-26". 4 February. P. 50, "Enhanced Open Spaces and Greenery."

Greater Chennai Corporation. 2022. "Council Resolution, 26 January 2022". Recital referring to Special Officer Resolution 1073/2020 and the adoption conditions.


Anirudh Burman is a researcher at the XKDR Forum.

Thursday, April 10, 2025

Be you ever so high, the markets are always above you

by Ajay Shah.

Purposive state action is fraught with error. Human and social systems are poorly understood and contain nonlinearities, so there is a law of unintended consequences. Grand schemes go wrong. What works well is a humble approach, of crossing the river by feeling the stones, in an environment of expertise. There are two rings of containment of power, that help address a regime which diverges from this approach.

Two rings of check-and-balance

The first ring of containment of power is the checks and balances of the political system. Liberal democracies work by dispersing power, by using ambition to counteract ambition. This curtails mistakes.

In some situations, these things break down. Power becomes concentrated, which induces mistakes. The second ring of containment is the financial markets.

  1. When Liz Truss was Prime Minister in the UK, the markets pushed back. The 30-year yield went from 3.6% to 5.1%. The GBP dropped 7.6%. The FTSE fell 7%. Ultimately, this led to her being ousted in 44 days.

  2. When Tony Blair and the labour party won the elections on 2 May 1997, the financial markets expressed skepticism. When a new government is greeted with a higher interest rate, this immediately curtails spending power. This pushed the new government to go through with a group of responsible decisions. On 6 May 1997 (i.e. 4 days after winning), they announced independence for the Bank of England coupled with the creation of an independent Debt Management Office so as to unburden monetary policy from the debt management conflict of interest. On 2 July, in the budget speech, they were cautious in their spending commitments. All these actions were crafted because the second ring of containment impinged upon the political leadership.

  3. Vijay Kelkar has long argued that the stock market crash of 17 May 2004 helped encourage Sonia Gandhi to choose the team of Manmohan Singh, P. Chidambaram and Montek Ahluwalia as the UPA economic policy leadership, which delivered the economic successes of 2004-2011.

  4. James Carville worked for Bill Clinton. A rough analogy into Indian politics would be Amar Singh. He once said: "I used to think that if there was reincarnation, I wanted to come back as the President or the Pope or as a 400 baseball hitter. But now I would like to come back as the bond market. You can intimidate everybody." This awareness tempered and shaped the early actions of the Clinton presidency, which worked out as a successful period for the American economy. 

  5. It is starting to work out similarly with the Trump Tariffs. The wheels of global general equilibrium started turning on 2 April, with forward looking forecasts embedded in financial market prices. Financial players everywhere asked: How well will the US economy work? Is the US the safe haven, with sound institutions, that we thought it was?

    The 10 year US Treasury went up from 3.9% to 4.5%. The 30 year bond briefly went up to 5%. The S&P 500 dropped 12.1%. Safe haven seekers turned to Germany, and yields on government bonds there fell. Larry Summers said on 9 April:  "We are being treated by global financial markets like a problematic emerging market".

    In my column in the Business Standard of 3 March, I had said that in the US, the first ring of containment has broken down --
    The US is in a constitutional crisis, with a failure of checks and balances, with the inability of the judiciary, the legislature, the electoral system, the agencies, the special counsel and the press to rein in a strongman.
    and that the second ring of containment would have to do its work --
    Market discipline will then impinge upon Trump and the MAGA world, and we hope, atleast partly kick them into shape. Be you ever so high, the markets are always above you.

Market discipline is not perfect. In the field of sovereign risk, we know well that the market tolerates a lot of fiscal misbehaviour for a long time, and then abruptly pulls access. Similarly, I have argued that the Indian equity market fares poorly on macro forecasting while it does well on micro-forecasting. The wrath of the market involves caprice. The key point here is that markets do speak truth to power, over and beyond the checks and balances of the political system.

A development perspective

The yearning for raw power is there in many people. On 9 April 2025, Donald Trump described his decision process: "Instinctively, more than anything else. I mean, you almost can’t take a pencil to paper. It’s really more of an instinct, I think, than anything else".  Montagu Norman, Governor of the Bank of England said in 1930: "I don't have reasons, I have instincts". For a country to have a high level of per capita GDP, this primeval yearning for power needs to be contained.

The first ring of containment is the checks and balances in the political system (e.g. converting the Bank of England into an inflation targeting central bank with dispersed power in the Monetary Policy Committee). A good financial system constitutes the second ring of containment that checks such impulses, that induces better decisions by the political masters.

From an Indian perspective, checks and balances are the essence of the growth journey. The first ring of containment is relatively well accepted (Kelkar & Shah 2022). More attention is required upon the second: a financial markets system that would induce checks and balances, that would matter enough to reduce the incidence of mistakes in public policy.

Consider government borrowing. When government borrowing takes place as a set of acts between consenting adults, where voluntary lenders negotiate a price on the bond market, this creates the checks and balances in the episodes narrated above. In India, about 95% of government borrowing is mobilised coercively (Chitgupi et. al., 2024), which limits the role that the financial markets play in reshaping the incentives of the state. 

Consider the exchange rate. The checks and balances in the episodes narrated above involved a starring role for the exchange rate. When poor countries run a government controlled exchange rate, this channel of influence is limited [EiE Ep67 Floating exchange rate], which sustains poverty.

In India, a disproportionate burden of adjustment falls upon the equity market as other markets adjust less.

In today's mainstream thinking, financial development is seen as integral to the journey of economic development through its allocative function.  `Finance is the brain of the economy', `Wall Street tells Main Street what to do'. The financial system should occupy `the commanding heights of the economy' and make all the detailed allocative decisions about firms, technologies or industries which receive investment [EiE Ep21 The beauty of finance]. A good financial system performs the allocative function better than `industrial policy' can [EiE Ep89 Industrial policy]. 

But finance plays another important function as well: that of reshaping the checks and balances of the state, or being the second ring of containment for power. The second ring of containment matters most when the first ring of containment -- checks and balances of the political system -- falters. These two lines of reasoning encourage us to place financial sector development at the centre of the growth journey [EiE Ep57 How to do development].

There was a time in India when we were making progress in building a financial system. This has faltered (Shah 2023;  EiE Ep71 The Journey of Finance). We need to get back to the knowledge building and community building that began in the early 1990s in this field.

Thursday, November 23, 2023

The journey of Indian finance

by Ajay Shah.

A great tool for making sense of things is a sense of history. At each point in time, we should wonder: what was the situation, what was the problem that was sought to be solved, what was done, how did it work out? This helps in all fields; e.g. we understand special relativity better when we understand the journey of ideas leading up to Einstein.

In this spirit, economic history is central to understanding economics. One of the great failures of modern economics is the loss of the economic history perspective. Most people in a formal education in economics do more convex optimisations than economic history, and that's unwise.

Latika Chaudhary, Tirthankar Roy and Anand V. Swamy invited me to write for their edited book, the Cambridge Economic History of Modern South Asia (forthcoming). I wrote a paper on the journey of Indian finance, starting at 1947. Many odd features of Indian finance make sense when viewed in this economic history perspective.

There is an important kind of economic history, an epsilon-delta tradition, where data, archival texts and documents are precisely pinned down. Alongside this, it is good to also have a strategic view. The paper has such a high level treatment of the journey of ideas, interests and institutions. It is organised as 10 sections on banking, the equity market, other financial firms, capital controls, bankruptcy, monetary policy, household finance, systemic risk, the working of financial agencies and the policy process.

In each of the 10 areas, I try to offer the birds eye view, a sense of what happened and why, of what got done and what didn't, and the forces at work. There is a unified chronology, evaluation and bibliography. Many epiphenomena are glossed over, so as to focus on the essence of finance: the play of time, risk, information, individual optimisation, and principal-agent problems. Each of the 10 area-essays needs to be turned into a full blown economic history paper, including epsilon-delta style work. This paper can help others get started on such research projects.

There are two ways to interpret the journey of Indian finance: a market failure view, and a public choice view.

On one hand, there was a journey of ideas, with learning (in some areas) about how state coercion can counter the market failures in finance. This is a story of building knowledge about the place of the state in Indian finance, and then building state capacity to try to help with useful interventions. The story contains many crises, some useful feedback loops, and some loss of institutional memory.

And then, there was the power conflict. The financial system constitutes the commanding heights of the economy. The Indian state has tried to control the financial system, and direct its resource allocation in ways that suit the state. There has been an ebb and flow of different degrees of state control, and different methods through which the control is achieved. Alongside this, policy makers have sought praise through isomorphic mimicry.

A lot was done in the two phases identified in the paper. But it is far from finished. The basic machinery of markets and financial firms is quite incomplete. State coercion in finance requires fundamental reorientation towards state capacity in addressing market failure, through clarifying the objectives of financial agencies and establishing their checks and balances. These difficulties are an important source of Indian economic underperformance: finance remains central to the journey of Indian economic development. The future of Indian finance lies in building the knowledge and the community for these tasks.

Friday, June 03, 2022

How "Orderly" is the Evolution of the Indian Yield Curve?

by Harsh Vardhan.

"Financial market stability and the orderly evolution of the yield curve are public goods and both market participants and the RBI have a shared responsibility in this regard."

Shaktikanta Das, Governor, RBI, October 2020

"Right from October 2020, we have given explicit guidance to the bond market. We expect an orderly evolution of the yield curve, it cannot be otherwise,"

Shaktikanta Das, Governor, RBI, February 2021

As the Covid pandemic has ebbed, central banks across the world are withdrawing the extra-ordinary easy monetary policy that was followed by them since the onset of the pandemic. Reserve Bank in India (RBI) is no exception. A week ago, it took the extra ordinary step of convening an ad-hoc meeting of the monetary policy committee (MOC) to hike the policy interest rates by 40 basis points and also increase the cash reserve ratio (CRR) for banks to take out liquidity from the banking system.

As this “normalisation” of the monetary policy unfolds, its impact on the financial stability has become a matter of concern. The statements of the RBI Governor quoted above, reflect the concern RBI has on financial stability and the evolution of the yield curve. While financial stability is a broad, all encompassing term, evolution of the yield curve is a much more specific idea that can potentially be objectively assessed. In this article I try to assess the orderliness of the evolution of the yield curve over the last four years.

Yield curve describes the basis interest structure in the economy. As the central bank takes policy actions bonds markets reprice the yields and the shape of the yield curve changes. As a fundamental input to pricing of a wide array of assets, predictable and orderly evolution of the yield curve is indeed desirable. High volatility and unpredictability in the evolution of the yield curve, especially when the policy actions taken to normalise monetary policy and regain the GDP growth trajectory post the pandemic, could result in mispricing of financial assets. RBIs concerns and expectation of such orderly evolution are understandable.

In this article, I try to assess the orderliness of evolution of the yield curve. I use data on the yield curve for the 4-year period of 1 April 2018 to 10 May 2022 to empirically assess how the yield curve has changed during this period. To be clear, this article does not evaluate the merits of the RBI’s intent or efforts at managing the yield curve; it only attempts to empirically assess how the yield curve has behaved over this period.

Assessing the evolution of the yield curve:

While it is easy to understand why policy makers would want the yield to evolve in an “orderly” manner in response to policy actions, it is not very easy to define what exactly an orderly evolution means. Trading in government securities takes place every day where all types of financial institutions participate. Even the RBI, through its treasury operations and open market operations participates in the government bond market. The collective actions of all these players determine the prices of government bonds and hence the yield on them.

We could hypothesise orderly evolution to mean that the daily changes in the yields across the curve are smooth and stable. There are two parameters we can look at the describe such smooth and orderly evolution – the volatility of daily yield change and the correlation of changes in yields across varying maturities. If the volatility of daily change in yields remains low and the correlation of yield changes across maturities is high, then it would mean that the yield curve is moving with the policy rates, in a non-disruptive and predictable manner. Such a yield curve can be considered as evolving orderly. On the other hand, increased volatility of daily change and reduced correlation would signal increase in the “disorder” in the evolution of the yield curve.

Data and analysis:

The data for this analysis is the daily yields data on the 3 month treasury bills (T Bills), 1 year, 3, year, 5 year, and 10 year maturity government securities (GoI securities) from 01 April 2018 to 10 May 2022, a total of 993 trading days of data obtained from Bloomberg. Of these maturities the 10-year securities are the most liquid and provide data for every trading day. For the other securities there are days where there would be no trading and hence no data would be available. We consider the previous days yield to continue for such non trading days which means that the change in yields for such days is considered to be zero.

For the purpose of my analysis, I divide the data into 4 time periods as follows:

The first period is from 1 April 2018 to 11 February 2019 which can be called the "pre low interest rate" period. RBI started cutting policy rates from February 19 up until May of 2020. Hence this is the period of stable policy rates. This period has data for 215 trading days.

The second period is from 19 February 2019 to 31 October 2020 is the "downward policy rates and pandemic period" when policy rates were reduced regularly to hit the lowest rate of 4% of repo by May 2020. I extend the period to Oct 31,2020 as RBI clearly started focusing on orderly evolution from October onwards. This period gives us data on 411 trading days.

The third period is from 01 November 2020 to 31 December 2021 which starts with the date of RBI publicly announced its focus on orderly evolution of the yield curve and ends with roughly the end of the pandemic and the reopening of the economy. While the end date is admittedly somewhat arbitrary it coincides with global trend towards rising rates that started in January 2022. This period gives us data on 282 trading days.

The fourth and the shorted period is from 01 January 2022 to 10 May 2022 is the last period where Indian interest rates started inching up (along with interest rates across the world). It includes a few days of data post the surprise, out of turn policy rate hike in May 2022. This period has data on 85 trading days.

For each of these four periods, I compute the following:

  • Daily change in the yields of each of the four maturity GoI securities.
  • Average daily yield change and the standard deviation of the change in the daily yield which I use as the measure of volatility of the daily change.
  • Correlation between yield changes of these 4 GoI securities.

Results:

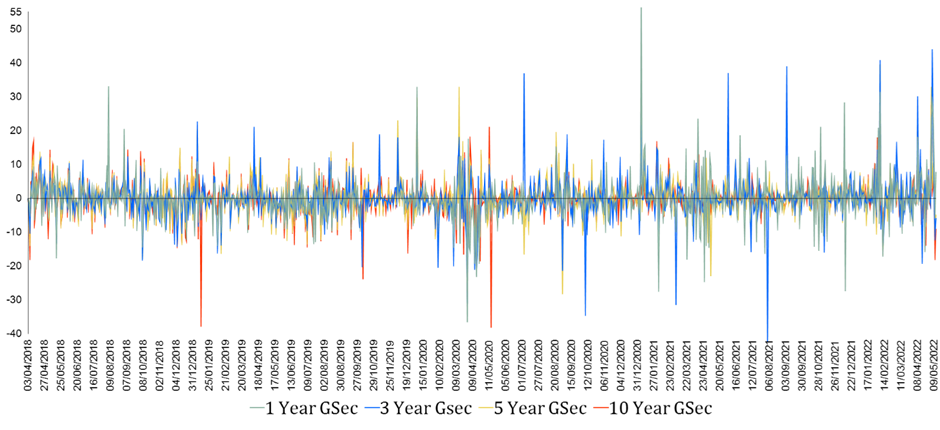
Figure 1 below presents a chart of the daily yield change in these 4 securities over this entire period of little over 4 years and 993 trading days.

Figure 1: Daily Change in Yields on GoI Securities in Basis Points

Source: Bloomberg, author’s analysis

Overall, the chart shows that the volatility of the daily change seems to go up with the onset of Covid in March 2020 with larger and more frequent spikes. This is especially true for the lower maturity; the 3 year and the 1 year maturity securities.

In order to understand the trends in the pattern of the daily change in yield, I plot the 30-day moving average of the daily change in yield as presented in Figure 2 below.

Figure 2: 30 Day Moving Average of Daily Change in Yields on GoI Securities in Basis Points

Source: Bloomberg, author’s analysis

Figure 2 clearly shows a pattern in the changes in the yield curve. The first period has much smaller change daily change in the curve and the changes across maturities are fairly highly correlated. The second period shows much more volatility in the daily change and a significant reduction in the correlation between yield change across maturity. This volatility comes down in the third period and the correlation improves, probably as an outcome of RBIs repeated exhortations and possibly actions in the bond market. The last period shows further reduction in volatility but the correlation is still lower than in the first period indicating that RBIs notices to the bond market and actions have had some success.

In order to more concretely understand the volatility and correlations across these periods, next two charts present the mean daily change in yields and the volatility of the daily change measured as the standard deviation of the daily change in yield.

Figure 3: Mean Daily Change in Yields on GoI Securities

Source: Bloomberg, author’s analysis

This chart clearly describes the interest rate trends in these four periods. The first period had, by and large, stable yield curve with very small changes in yields. The second period shows a secular decline in interest rates across all maturities in response to policy rate changes. The third period shows a reversal of trends and modest rise of interest rates ie the upward movement of the yield curve which becomes much more pronounced and sharper in the fourth period.

Figure 4: Volatility of Daily Change in Yields on GoI Securities

Source: Bloomberg, author’s analysis

This chart shows that the volatility of yield changes has indeed gone up noticeably in the third period when the overall rates showed an increase. The volatility increased especially for the shorter maturity papers – 1 year and 3-year maturity. This probably is the basis of the RBIs focus on ‘orderly’ evolution and hints to the bond market of its discomfort with high volatility. The fourth period shows that the elevated volatility has persisted which means that the bond market has responded only modestly to the RBI’s exhortations. Another important feature to note is that the volatility of the 10 year and the 5 year maturity securities has been contained in the third and the fourth period while that of the shorter maturity securities has continued to remain high. This possibly could also be due to RBI’s targeted interventionsh in the bond market to contain the rise and volatility of yields on long term securities.

Finally, I look at the correlations of yield changes across these maturities. Table below presents the correlation matrix of the four periods.

Table: Correlation Matrix for Yield Change in GoI Securities of Varying Maturities

Source: Bloomberg, author’s analysis

The correlation matrix shows high correlations between yield changes in the first period that start going down in the second period and decline precipitously in the third period. While they improve in the fourth period, they are still below the high levels of the first period. Clearly, the yield curve moved more haphazardly in the third period with high volatility and low correlation between yield changes across maturities. The fourth period shows improvement in correlations probably due to RBIs constant notices to the bond market (and its possible interventions in the market), they do not reach the levels of the first halcyon period.

Conclusion:

This data shows that RBI concern on orderly evolution of yield curve is well placed. The data clearly shows that in period 2, as the policy rates came down, the yield curve volatility shot up. It may well be that the RBI’s focus during this time was on keeping the long-term interest rates low to facilitate economic recovery during the pandemic. The bond market, on the other hand, was concerned about the economic impact of the pandemic and resulting tussle between the RBI and bond market participants actions resulted in increased volatility and break down of correlations in yield movements across maturity. RBI became aware of this volatility towards the third quarter of fiscal 2022 and realised that low rates will not be enough for economic recovery and the excess volatility must be curbed. As it started expressing its desire of an orderly evolution (accompanied possibly by market interventions) there was a modest decline in volatility and improvement in correlations. However, the markets are still not anywhere close to the halcyon pre-pandemic period.


Harsh Vardhan is an independent management consultant and researcher based in Mumbai. The author thanks Surbhi Bhatia for research assistance, and Josh Felman and anonymous referees for very useful comments

Wednesday, May 26, 2021

Litigation in public contracts: some estimates from court data

by Devendra Damle, Karan Gulati, Anjali Sharma and Bhargavi Zaveri.

Introduction

Public contracts are contracts executed by the government and its agencies to procure goods, services and works. Public contracts in India are perceived to be litigation prone. There is evidence that more than half the road projects awarded by the government of India were the subject matter of litigation before the courts and arbitration tribunals, and that a significantly large value of infrastructure projects are stuck in litigation for prolonged periods. This article seeks to estimate and understand the volume and nature of litigation relating to public contracts by observing litigation in one high court in India.

Understanding the volume, value and nature of litigation arising in public contracts is critical. First, the government is an active procurer of goods, services and works in several large sectors such as natural resources and infrastructure. The state's litigation propensity in contracts is a key factor in the ease of doing business in such sectors. Second, the propensity of each government department and agency, such as the union, states, urban local bodies, CPSEs and SPSEs, to engage in litigation may vary. Assessing the litigation propensity of different government departments and agencies helps contractual counterparties assess the costs of dealing with them. Third, estimating the volume, value, costs and outcomes of government litigation helps understand its impact on the exchequer. It can serve as a useful feedback loop in planning the litigation policy of the government and its agencies.

Our analysis suggests that the government is a counterparty to more than half the civil commercial litigation in the Delhi High Court. However, a small proportion of this litigation can be linked to disputes in public contracts. Second, we find that the government is not a major initiator of, but is a large defender in litigation involving public contracts. However, more than 50% of the cases filed by the government against businesses are of one type, namely, challenges to arbitration awards passed in disputes arising in public contracts. Finally, we find that businesses are not using the standard legal remedy of suits for enforcing contractual claims against the government or its agencies. This suggests that most of this litigation is related to the pre-award stages of the business-government engagement. This could also be attributed to the procedural simplicity of proving claims in writ petitions and the relatively quicker duration within which they get disposed.

The popular discourse on government litigation has focused on the volume and pendency of the litigation to which the government or its agencies are a counterparty. Our findings, although limited to observations to the Delhi High Court, provide a foundation for drawing up data-backed country-level estimates of the government's propensity to litigate, and the time, costs and court capacity consumed in litigation relating to public contracts.

Data and approach

For our analysis, we start with a dataset of cases filed before the Delhi High Court from 1st January 2007 until 30th September 2020 ("study period"). We select the Delhi High Court for our analysis for two reasons. First, the Delhi High Court is one of the five High Courts in India exercising original jurisdiction over contractual disputes. All High Courts in India, except these five, exercise appellate jurisdiction. This means that they restrict themselves to reviewing the lower courts' orders. The Delhi High Court is the first level dispute redressal forum for disputes within its territorial jurisdiction in commercial contracts exceeding Rs. 2 crores. The second reason is the physical proximity of the Delhi High Court to the central government and its agencies.

The objective of our analysis is to understand litigation in public contracts. The Delhi High Court classifies case-types into 288 categories. During the study period, 5,42,355 cases have been filed before the Delhi High Court across these categories. These categories cover every type of case that the court deals with, ranging from admiralty cases to family disputes. We undertake three rounds of data filtering to arrive at a subset of cases that are the closest proxies of contractual disputes involving the government.

Filtering out cases not involving contractual disputes with the government

In the first instance, we filter out all the case-types which are not related to contracts. For instance, we filter out bail and criminal applications, testamentary and tax matters and matters under the Companies Act and contempt petitions. We filter out all appellate matters and references from lower courts. We filter out cases where either of the parties is unknown or the data is not machine-readable. This gives us a dataset of 2.2 lakh civil cases filed in the study period. Of these, 1,37,734 cases (about 62%) have the government or its agencies as a counterparty (Table 1). This dataset includes completed as well as pending cases. 81% of the cases in our dataset are disposed of.

Table 1: Cases in our data to which the state or its agency is a counterparty
 
Sr.No. Party-type As Petitioner As respondent Total (% of government cases)

1. Union of India 8020 58,184 66,204 (48.06)
2. State Government 2443 31,539 33,982 (24.62)
3. Municipal bodies/panchayats 2174 16,121 18,295 (13.28)
4. CPSEs 3908 9021 12,119 (8.79)
5. SPSEs 1161 3427 4,588 (3.33)
6. Court 171 833 1,004 (0.72)
7. Constitutional bodies 189 543 732 (0.53)

Total 18,066 1,19,668 1,37,734 (100)

Constitutional bodies in Table 1 refer to constitutional authorities, such as the Comptroller and Auditor and General of India. The Union of India includes the government of India, statutory authorities set up under a central law such as the National Highways Authority of India (NHAI), and statutory regulators such as SEBI and TRAI. Table 1 demonstrates that a bulk of the civil commercial litigation in the Delhi High Court has the government as a counterparty. It also shows that while the state is not responsible for initiating large amounts of civil commercial litigation, the state and its agencies constitute the largest respondent in such litigation.

We classify the Government-cases in Table 1 into five categories: civil writ petition, civil suits (original side and commercial), miscellaneous petitions (original and civil misc main), arbitration petitions and applications and land acquisition-related disputes (Table 2).

Table 2: Types of government related cases in our data
 
Sr.No. Civil writ petitions Govt. as Petitioner Govt. as respondent Total (% of government cases)

1. Writ petitions 10,476 1,06,179 1,16,655 (84.69)
2. Miscellaneous petitions 3,493 5,168 8,661 (6.28)
3. Land Acquisition related cases 3,180 3,663 6,843 (4.9)
4. Arbitration petitions and applications 221 2,837 3,058 (2.54)
5. Civil suits 696 1,818 2,514 (1.8)

Total 18,066 1,19,668 1,37,734 (100)

Table 2 shows that civil writ petitions constitute the bulk of the cases involving the government and its agencies. Writ petitions are, by design, cases filed against the government or its agencies for the violation of fundamental rights and not contracts. However, anecdotally, we know that contractual claims against the government and its agencies are often agitated through civil writ petitions. Hence, we retain civil writ petitions for our analysis.

Findings

While the government is a counterparty to 1.4 lakh or 60% of the civil commercial cases in our data-set, a bulk of these cases are by and against individuals and other types of entities such as trade unions or political parties. These disputes would therefore largely pertain to employment matters such as unfair dismissals, denial of promotion in government service or pension and evictions from public premises. The objective of our study is to understand the litigation arising out of public contracts.

Litigiousness

For our study, we characterise only cases filed by or against businesses (body corporates incorporated as private or public limited companies) as public contracts-related litigation. This is because our data covers public contracts whose value exceeds Rs. 2 crores. Public contracts exceeding this threshold value are awarded through a tender process. The condition that a bidder for public contracts should be incorporated as a company is commonly found in government tender documents.

In the sub-set of writ petitions, we retain writ petitions between businesses and a sub-set of government agencies, such as CPSEs (except banks) and SPSEs, and statutory agencies that are engaged in procurement, such as the National Highways Authority of India (NHAI), Airports Authority of India (AAI), the Delhi Metro Rail Corporation (DMRC) and the National Buildings Construction Corporation Limited (NBCC) in our data.

We exclude writ petitions filed against government owned banks as they largely pertain to debt restructuring and not procurement-related disputes. We also exclude the writ petitions filed by businesses against the government of India, constitutional authorities and State Governments from our analysis as a large percentage of them pertain to tax matters, constitutional challenges to laws enacted by the Parliament and state legislatures respectively, and executive actions, such as notifications and circulars issued by the government and state governments respectively. Similarly, a review of a sample of writ petitions filed by businesses against municipal bodies and panchayats suggests that they largely pertain to matters involving eviction from public premises and violations of licensing norms governing commercial establishments operated by such businesses. We also exclude land acquisition-related matters as they are largely challenges to notifications issued by the government notifying land parcels for compulsory acquisition and other actions undertaken by the government under the land acquisition laws.

This exercise of filtering may exclude some contractual disputes between the government and its contractors or vendors. Our findings are therefore based on a conservative estimate of the volume of litigation in public contracts.

This filtering exercise generates a subset of 9,313 cases between businesses and the government and its agencies (Table 3). We use this subset of cases as a proxy for litigation between the government and businesses in connection with public contracts. Table 3 suggests that such litigation is a small proportion (about 7%) of the overall litigation involving the government. Further, the state is not a major initiator of such litigation. Businesses initiate the bulk of the government-business contractual litigation. The CPSEs account for nearly half of such litigation in the Delhi High Court. This suggests that while CPSEs are a small contributor to the overall commercial litigation involving the government (as shown in Table 1), they are a large contributor to the litigation involving public contracts. The central government and several states have issued policies to manage and curb litigation by the government and its agencies ( example, example and example). These policies have largely taken a top-down approach towards minimising litigation at the level of the union and state governments. Our assessment suggests that there is potential for the government to explore the incentive structures at the level of the departments within the Union government and CPSEs that drive litigation arising from public contracts.

Table 3: Cases between government and businesses
 
Business as Petitioner Business as Respondent Total (% share)

CPSE 3,329 1,223 4,552 (48.87)
Union 2,027 885 2,912 (30.26)
State 711 249 960 (10.30)
Panchayat/Urban local body 412 124 536 (5.75)
SPSE 239 111 350 (3.75)
Autonomous constitutional 3 0 3 (0.03)

Total (% share) 6,721 (72.16) 2,592 (27.83) 9,313 (100.0)


Case types

Table 4 shows that the bulk of the government initiated litigation is in the 'original miscellaneous petitions' (OMPs) category. Conversations with practitioners and support staff of the judges in the Delhi High Court suggest that as large as 70% of the cases filed as OMPs in the Delhi High court involve challenges to the enforcement of arbitration awards. We also reviewed a small sample of OMPs, which confirmed this perception. Arbitration petitions and applications account for the second-largest type of cases involving the government and businesses. These petitions are generally filed for directions from the court for the appointment of an arbitrator where either party to the dispute fails to appoint one, interim relief during arbitration proceedings and extension of timelines for conducting the arbitration. The high proportion of 'OMPs' and 'arbitration' cases in our data suggests that a significant proportion of government-business contractual litigation is getting resolved by arbitration.

We also find that a bulk of the writ petitions filed by businesses in our dataset (a little more than 84%) are against CPSEs. This pattern holds over the entire window of observation. We estimate that these writ petitions could pertain to disputes in two areas of public procurement. They may pertain to violation by CPSEs of procurement norms in the tendering phase of public procurement. The second possibility is that they could pertain to disputes in the post-award stage, such as delayed payments or other wrongful acts during the term of the contract. This is problematic because writ petitions are a remedy for the enforcement of fundamental rights against the government. Courts have repeatedly denied purely contractual claims against the government through the remedy of writ petitions. However, if the writ petitions against CPSEs indeed pertain to disputes arising post the tender award, it suggests that businesses find it efficient to agitate contractual claims through writ petitions. This may indicate a judicial tendency to prioritise writ petitions over other matters. This could also be attributed to the relatively lower threshold for proving claims in writ petitions.

Table 4: Government to business (G2B) and Business to government (B2G) commercial litigation
 
WP CS OMP Arbitration Others Total

G2B 69 276 1938 152 157 2,592
B2G 932 895 2704 1973 217 6,721

Total 1,001 1,171 4,642 2,124 3749,313


Time taken

Approximately 1.7 lakh of the 2.2 lakh cases in our dataset are disposed cases. We find that the average disposal period for a case in our data is about one year from its institution. For this subset of disposed cases, we calculate the average duration for disposal in years based on the year of institution to the year of disposal (Table 5). The average duration for the disposal of writ petitions is lower than that for civil suits and lower than the overall average. This reinforces the notion that counterparties to government contracts may be enforcing their contractual claims through writ petitions.

Table 5: Average duration for disposal (by case-type)
 

Case-type Average time for disposal (in years)

Writ petitions (civil) 0.81
Civil suits (original)* 2.30
Civil suits (commercial bench)** 1.01
Miscellaneous petition 1.17
Arbitration petitions, applications, etc.0.56

Overall 0.98

*Suits disposed of by a regular bench of the court.
**Suits disposed of by the commercial division of the High Court set up under the Commercial Courts Act, 2015.

Table 6 shows the number of years for the disposal of cases in the overall data, cases to which the government is a party, and other cases. Table 6 suggests that a bulk of the commercial cases are disposed of by the Delhi High Court within two years from the date of their institution. We also find that a significantly higher number of commercial cases involving the government are disposed of within a year compared to the other cases. This is contrary to the popular perception that delays prolong government litigation. This does not appear to the case for commercial litigation involving the government. In fact, we find that commercial cases involving the government as a respondent and those not involving the government require, on average, the same number of hearings by the court before their disposal. This suggests that a commercial case involving the government does not, on average, consume more resources of the court than regular cases.

Table 6: Duration of disposed cases (party-wise)
 
Number of cases (% share)

Duration (years) Overall Govt and businesses Business and non-govt party

Less than 1 95,962 (54.01) 13,867 (57.75) 19,724 (43.74)
[1, 2) 42,931 (24.16) 5,618 (23.4) 13,521 (29.98)
[2, 3) 17,064 (9.6) 1,902 (7.92) 4,901 (10.87)
[3, 4) 9,475 (5.33) 1,011 (4.21) 2,716 (6.02)
[4, 5) 4,682 (2.64) 467 (1.94) 1,414 (3.14)
[5, 10) 6,807 (3.83) 993 (4.14) 2,576 (5.71)
Greater than 10 745 (0.42) 153 (0.64) 246 (0.55)

Total 1,77,666 (100) 24,011 (100) 45,098 (100)


Conclusion

Our findings are limited to our observations on the government litigation in the Delhi High Court.

Some of these observations confirm pre-conceived notions of litigation between the state and businesses in India. For example, data from the Delhi High Court demonstrates that so far as concerns civil commercial cases, the government is a party to more than the popularly cited 46% of the cases in courts. However, very little of this litigation is attributable to public contracts between business and the state. Similarly, the usage of writ petitions to enforce contractual claims against the state is documented to some extent in court judgements. Our data demonstrates a high proportion of writ petitions linked to the enforcement of public contracts. This may be partly attributable to the nature of the claim involved and the relatively higher average duration for the disposal of suits. Some of our findings help dispel some pre-conceived notions. For example, the widely held perception that the government prolongs litigation is not true of commercial cases adjudicated before the Delhi High Court, as shown by the average number of hearings taken for commercial cases involving the government and those not involving the government. This may also be reflective of the capacity of the Delhi High Court itself.

A quantitative assessment of the government's litigation is important for identifying the precise bottlenecks that lead to the government being sued and designing a litigation policy that responds to these considerations. Data backed assessments of the litigation load of the government holds important insights into the costs of doing business with the government and the resources required within the state and in courts to deal with such litigation. This work provides a foundational understanding of commercial litigation involving the government in India. Better and deeper country-level insights can be obtained by expanding the assessment to more courts and potentially undertaking a textual analysis of the final orders in such litigation to identify aspects such as the success ratio and litigation costs.


Bhargavi Zaveri is a researcher at xKDR- Chennai Mathematical Institute. Devendra Damle and Karan Gulati are researchers at the National Institute of Public Finance and Policy. Anjali Sharma is at National eGovernance Services Limited.