Search interesting materials

Showing posts with label author: Ila Patnaik. Show all posts

Thursday, October 26, 2023

On the usefulness of Parliamentary law in achieving fiscal responsibility

by Pratik Datta, Radhika Pandey, Ila Patnaik and Ajay Shah.

Economists in India have long pondered the design of a fiscal rule. It is felt that once that ideal rule is embedded into the FRBM Act, we would solve the long-standing excesses of Indian public finance.

Pratik Datta, Radhika Pandey, Ila Patnaik and I looked under the hood, at the legal mechanisms through which such a Parliamentary law works. In a recent paper, Understanding deviations from the fiscal responsibility law in India, we argue that the difficulty lies not in economics but in the Indian constitutional arrangement. Because the budget is enacted through a `money bill', it can readily contain clauses that amend the FRBM Act. We argue that the problem with the FRBM Act lies not in the economic thinking but in the notion that Parliamentary law can constraint leviathan.

On the subject of public finance, the following design elements are embedded in the Constitution:

  1. The executive cannot raise money (tax or borrow) or spend money without the authority of the Parliament.
  2. The power to raise money (tax or borrow) or spend money belongs exclusively to the Lok Sabha. The philosophy of checks and balances associated with the presence of the Rajya Sabha, so eloquently described by Suyash Rai in 2016, is absent when it comes to money bills.
  3. The Parliament cannot authorize expenditure except on demand by the Executive.
  4. The Parliament cannot authorize taxation except on recommendation by the Executive.
  5. The Lok Sabha has the power to assent to, reject or reduce but not to increase the amount of any demand made by the Executive under Article 113(2). The Parliament can neither suggest any new expenditure nor propose an increase in demand over and above what the government suggests in the Demand for Grants.

Normative public finance in India needs to grapple with this design of the Constitution. The power of the executive, embedded in this design, should be seen as part of the larger problem of the Indian administrative state. A generation of public finance economists in India have tried to solve the chronic deficits of the union government through Parliamentary law. We suggest that this is not a fruitful line of inquiry.

Thursday, September 30, 2021

Distribution of self-reported health in India: The role of income and geography

by Ila Patnaik, Renuka Sane, Ajay Shah and S. V. Subramaniam.

In health research, we study the causes and consequences of health at the individual level. This requires measurement of the health status of individuals. One simple path lies in asking a person: "Are you feeling well today?". This `self-reported health' (SRH) is a measure that is easy to implement, and has limitations in that psychological factors are present. A significant global literature has emerged, which draws on this measure to explore the causes and consequences of health.

The CMIE CPHS is an important new dataset which has longitudinal data for about 170,000 households, measured three times a year. They measure SRH for each individual in each wave. This measurement of SRH, alongside a rich array of household characteristics, makes possible many interesting research projects. In a new paper, Distribution of self-reported health in India: The role of income and geography, we discern some new facts and phenomena about health in India, through this data.

We use data for calendar 2018 and 2019, which works out to 3.5 million observation of a person in a wave. These years were chosen in order to obtain a baseline description of health in India, while avoiding the pandemic of 2020 and the possible impact of demonetisation in 2017.

What do we find? On average, ill health is observed in 3.25% of the records. On average, people in India are unwell for about 12 days a year. There is a U-shaped curve in age, with higher ill health rates for the young and the old.

We get a nice map of the variation of the ill-health rate across the country. This is interesting, in and of itself, as it shows us something about health care requirements. However, some of this variation reflects geographical heterogeneity in income and age structure.

We estimate logit models which explore correlations between standard socio-economic measures and the ill-health rate. The important sources of variation turn out to be age, income and location.

We then focus on an approximately modal person. Model-based predictions for the ill-health probability are constructed for this individual. This yields a map of the predicted ill-health rate --  


This shows the variation of ill-health in the 102 `homogeneous regions' (HRs), after controlling for income, age structure and other standard socioeconomic characteristics. It is an interesting and new map. These results do not conform with the standard stereotypes of north vs. south. Epidemiological research is required in understanding what is at work in each of the difficult HRs. Major gains in the health of the people could potentially be obtained by focusing on these hot spots and finding the right public health interventions.

We then ask: are rich people healthier than poor people? As the rich fare better on nutrition, housing quality, knowledge and access to health care, we expect there would be such a correlation. This is indeed the case in the overall aggregate data. However, there is strong geographical variation in this correlation. Ill health and poverty are positively correlated in only half of the country. There are even HRs where the relationship is reverse -- where poor people report better health than the rich. Further, the two maps (the map of ill health of the modal person, and the map of the places where ill health is not positively correlated with income) show different patterns. They are distinct phenomena that invite further exploration.

Thursday, September 03, 2020

Thomas Laubach

by Ila Patnaik and Ajay Shah. 

Our dear friend, Thomas Laubach, died in the US, yesterday.

Thomas reached out to us in 2011. He wanted to spend time in a research group in India that worked in macroeconomics. Thomas, his lovely wife Tahniyat and their three children were in India for 3 months, then. Apart from NIPFP, they visited Amravati where Tahniyat’s family came from.

Thomas fell in love with Delhi in those sunny winter months. At NIPFP, his happy smile encouraged even the youngest members of the staff to go and talk to him. He tried to communicate his excitement and passion about what had been achieved in the last century. 

We were engaged, in those years, in trying to figure out a first principles understanding of Indian macroeconomics. Thomas, a former Ph.D. student of Ben Bernanke, was a great influence for this work. He brought immense knowledge of the edifice of modern macroeconomics of advanced economies, and at the same time was sympathetic and supportive of the idea that we had to figure out what makes sense under Indian conditions from scratch. We spent endless hours with him, groping in the facts, looking for the conceptual machinery that made sense and was consistent with the big facts. He cared about understanding the world, and being useful in the world, over and beyond the normal academic incentives.

At the time, Thomas was an academic at Goethe University in Frankfurt. Shortly after he finished at NIPFP, he joined the US Federal Reserve Board. Whenever one of us visited DC, Thomas would be happy to meet. He would always find time for a quick coffee in work hours. Tahniyat would be warm and welcoming and cook a lovely Indian meal at home.

Through the following years, we met Thomas regularly, as he would visit India regularly, and we would coordinate days with him in Delhi and Bombay. He loved walking in Bombay, and his answer to `what would you like to do today' was always "I want to see Bombay through your eyes". He loved stepping out to restaurants in Delhi for the local food. When he could not get leave to come, he  missed India, and would write to us remembering his lovely winter days of Delhi, calling his feelings the IWS (India Withdrawal Symptoms). His last visit to India was on a short trip in February 2019.

In Bandra (West), a favourite walking region

He was very curious about how India worked. He knew that the emerging markets were going to become more important, and that what made them tick was fundamentally different from what was well understood elsewhere. Sometimes it felt like he was an anthropologist talking with us about what we were doing, and he would go under the hood, seeking the thick description.

We always looked upon his time at the US Fed as a busy interlude, and then he would get back to doing something closer to research, with more control of his time. We had planned that he would join a Sahyadris trek on a post-Fed winter visit to India. It is so cruel, that life worked out like this.

Monday, April 06, 2020

Release of v2.0 of the Exchange Market Pressure dataset associated with PFM 2017.

by Josh Felman, Madhur Mehta, Ila Patnaik, Ajay Shah, Bhavyaa Sharma.

The idea of Exchange market pressure (EMP) was introduced by Girton and Roper (1977). It suggests measurement of the total pressure on the exchange rate, some part of which is visible as the change in the exchange rate, and the remainder is resisted by currency trading of the central bank. Many researchers have worked on devising EMP estimators, the most prominent of which are Eichengreen et al. (1996), Sachs et al. (1996), and Kaminsky et al. (1998). EMP measures have been utilised in thousands of papers in international finance and macroeconomics.

In Patnaik et al. (2017) we proposed a new method for calculating EMP which attempts to overcome the well known problems of conventional EMP measures. Alongside this paper, a cross-country dataset was released, which ran from January 1996 to May 2017.

We have done a second release of this dataset, which carries these series forward to November 2018. In this dataset, which is numbered as v2.0, we have 135 countries. On the web page, we have a CSV file of the dataset, and also the few lines of R code that get you going on using it. The URL of this web page will be stable, and the next release will come out with further updation of the dataset in a few months.

In the v1.1 dataset, due to lack of annual macroeconomic data for some countries, the rho values were computed with erroneous confidence bands, which consequently affected the EMP values. We have corrected this error.

In the following paragraphs we compare version 2.0 of the new measure of EMP further for four countries, namely, India, China, Russia, and Brazil against the conventional EMP measure of Eichengreen et al. (1996). This helps give intuition about the gains from the new measure.

Example: EMP for China


In the figure above, the two grey rectangles in the conventional EMP measure plot for China are periods where the value of the EMP measure are near infinity. The new EMP measure does not have this problem.

The new EMP measure shows that in years prior to the Lehmann Brother's collapse, there was persistent appreciation pressure on the RMB. After the Lehman default, a sudden shift in the exchange market pressure can be seen. These phenomena are not present in the conventional measure.

A significant event for China occured on 12 June 2015, when a financial crisis began. The new EMP measure shows this depreciation pressure better than the conventional measure.

Example: EMP for India


In India's case, the Lehman default in 2008 brought about a sharp depreciation in the value of indian rupee. This story is nicely told in the new EMP measure. The conventional measure suggests that there was a switch from depreciation to appreciation pressure at that point.

Prior to the taper tantrum of 2013, the entire year of 2012 had high volatility in the rupee exchange rate. In the tantrum, there was high pressure on the rupee value to depreciate. These facts are well-represented in our measure of EMP, and consistent with a detailed understanding of that period, as opposed to the conventional one.

Example: EMP for Russia


In the case of Russia, the conventional measure fails to show the magnitude of the effect of the Lehman default, the taper tantrum and the Russian invasion of Ukraine in 2014. The new EMP measure has the correct features: that these events imposed depreciation pressure on the rouble.

Example: EMP for Brazil


In the case of Brazil, the Lehman default and the taper tantrum of 2013 imposed high depreciation pressure on the Brazilian real, in the new EMP measure, but not in the conventional measure.

References


Eichengreen, B., Rose, A., Wyplosz, C., 1996. Contagious Currency Crises, Technical Report. National Bureau of Economic Research.

Patnaik, I., Felman, J. and Shah, A., 2017. An exchange market pressure measure for cross country analysis. Journal of International Money and Finance, 73, pp.62-77.

Desai, M., Patnaik, I., Felman, J. and Shah, A., 2017. A cross-country Exchange Market Pressure (EMP) Dataset. Data in Brief.

Girton, L., and Roper, D., 1977. A monetary model of exchange market pressure applied to the postwar Canadian experience. American Economic Review, vol. 67, pp.537-538

Sachs, J., Tornell, A., Velasco, A., 1996. Financial crises in emerging markets: The lessons from 1995. National Bureau of Economic Research.

Kaminsky, G.A., Lizondo, S. and Reinhart, C.M., 1998. Leading indicators of currency crises. Staff Papers-Int. Monet. Fund (1998), pp. 1-48.


We thank Shekhar Hari Kumar and Namita Goel for their work on this release.

Tuesday, December 24, 2019

Chennai 2015: A novel approach to measuring the impact of a natural disaster

by Ila Patnaik, Renuka Sane, Ajay Shah.

In November and December 2015, the city of Chennai in the Southern Indian state of Tamil Nadu, got heavily flooded owing to unprecedented rainfall. With a population of a little more than 7.1 million people, Chennai is one of the major urban centers of South India, and one of the four important metropolitan cities in India. The flooding is estimated to have led to the loss of more than 500 lives, and damages of about US $3 billion, making it the world's eighth most expensive natural disaster in 2015. In this paper we evaluate the impact of this event for households in Chennai.

Natural disasters, such as the Chennai floods, are important shocks which can influence all parts of the income distribution. In the aftermath of such a natural disaster, the issues of consumption smoothing, liquidity constraints and financial resilience play out. Natural disasters are important in their own right, as we need to understand more about the turmoil faced by households in such states of nature. All governments engage in redistribution in the aftermath of a natural disaster. This motivates research on studying the impacts of natural disasters. Natural disasters are also an opportunity to obtain insights into the economics of household, through observation of households when confronted with such a large shock.

Many researchers have gone into the field after a natural disaster has taken place, and produced evidence about health, income, consumption, and financial conditions in the aftermath of the disaster. But such research does not offer insights into the causal impact of the event as adequate information gathering about baseline conditions, before the event, is lacking.

When panel data about households is present, we observe households before and after the natural disaster. This makes possible the analysis of the adverse impact upon affected households, while additionally observing controls. The constraint in such research has been the time elapsed between two consecutive observations of each household. As an example, even if a panel is measured once a year, there would be many months of elapsed time between the two measurement dates that bracket a disaster event.

In a new NIPFP working paper, Chennai 2015: A novel approach to measuring the impact of a natural disaster we exploit the new opportunities for measurement which flow from the CMIE Consumer Pyramids Household Survey ("CPHS"), which measures a panel of 170,000 households across India. Each household is met with three times a year. There is thus a period of four months, across which the household is measured twice, within which each natural disaster lies. We setup difference-in-difference estimation where households in Chennai are the ``treatment'' group and unaffected households in the rest of the state of Tamil Nadu are the ``control'' group. As households in Chennai are among the more affluent ones in Tamil Nadu, the raw dataset has poor match balance, and we address this problem by also performing matched DiD analysis.

We investigate three questions. First, we evaluate the impact of a flood on household income and consumption expenditure. It is possible that a disaster leads to declines in household income and expenditures owing to the destruction. However, it is also possible that households increase their spending to cope with the disaster, or replace capital stock. For example, some household activities, such as cooking, would shift from internal production to purchases from external providers, which would augment demand for certain goods and services. Households would start buying goods and services for reconstruction almost immediately after the destruction. Large scale expenditures on relief and reconstruction by the Indian state would bolster the local economy.

We find that there was no statistically significant impact on household income during the flood months. Households in Chennai, however, saw a 32% increase in consumption expenditure relative to the non-affected districts. The largest percentage increases in expenditure were seen on health, and power and fuel.


A key figure is shown above. The dotted line is for the controls and the deep green line is for households in Chennai. In both cases, what is shown is the monthly expenditure per person. The vertical black lines bracket the flood events.

At the outset, the households observed in Chennai are, on average, more affluent than the controls. Roughly speaking, we do have parallel trends in the period prior to the flood. During the flood, there was a large surge in expenditure which runs for many months. After that, consumption went down, to a point where the Chennai households were now comparable with those seen in the rest of Tamil Nadu.

Second, we evaluate the variation in the change in expenditure for different households. The adverse impact upon persons who live in structures with inferior structural strength is likely to be larger. We categorise households as more vulnerable, or more financially constrained, through various characteristics such as not having a concrete roof, or not having modern finance (such as life insurance, mutual funds, equity market participation), or not having durable goods (such as ACs, refrigerators etc). We find that the consumption expenditure of the these weaker households increases by a smaller amount than those not financially constrained. This might mean more hardship, and a higher inability to cope with catastrophic events.

Third, we evaluate the mechanism that households use to finance the higher consumption. Households could either draw down their savings, or increase their borrowings to finance expenditures. Our analysis suggests that relative to the control group, fewer households in Chennai saved, borrowed, or purchased assets, in the period after the floods. This suggests that reduced savings and reduced purchase of assets was the channel through which the consumption surge was financed. In our data, after about a year, the consumption surge ended, and was followed by a further decline in consumption. This may be consistent with households refocusing on repairing their balance sheet.

Natural disasters kill around 90,000 people and affect close to 160 million people worldwide. The frequency and intensity of disasters are expected to increase with global warming. Greater understanding is required about how natural disasters impact economic outcomes, so that better public and private responses may be designed. The contribution of this paper lies in bringing new tools of measurement (panel data, three times a year, matched DiD) to bear on an important problem (natural disasters) and discover the phenomena that are at work. The novel estimation strategy shown here can now be applied for many natural disasters in India. Over time, a body of work can develop of this nature, through which more abstract insights can be obtained.


The authors are researchers at NIPFP.

Monday, January 21, 2019

The rise of government-funded health insurance in India

by Harleen Kaur, Ila Patnaik, Shubho Roy and Ajay Shah.

The National Health Protection Scheme (NHPS) announced in the Budget 2018-19, targets providing affordable health care to 100 million poor households in India. It is arguably the world's largest health insurance scheme and an indicator of transformation of the role of government from being a health care provider, to that of a health care financier. Before independence, India focussed more on public health through interventions like water supply, sanitation and vaccination than providing health care through hospitals. The reorganisation after independence was a result of policy changes that merged public health and health care responsibilities within the same officers of the government, the doctors. A remarkable development in the field of health policy in India is the rise of government funded health insurance programs.

These programs feature purchases of health care services from private health care providers health insurance from health insurance companies. In a recent paper titled, The rise of government-funded health insurance in India, we discuss the history of health policy in India in three phases; pre-independence British India, independent India until the 2000s and independent India after 2000s, to understand the factors contributing to the shift in the health system of the country.

We offer fresh insights into these developments by placing them in a historical perspective. The roots of Indian health policy lay in British India, which laid the foundations of public health. This was done after the Royal Commission of 1859 was set up to investigate the health status of the army in India. The Royal Commission studied not just the army, but the civilian population as well. By and large, their emphasis was on public health and not on health care. The findings of Royal Commission can be summarised in two quotations:


  1. The need for public health rather than health care
  2. "Native hospitals are almost altogether wanting in means of personal cleanliness or bathing, in drainage or water-supply, in everything in short, except medicine."
  3. The need for interventions outside of soldiers
  4. "The health of the English army is indissolubly associated with the health of the population of the country which it occupies"

The legislative and institutional apparatus that was established in British India involved a prime focus upon public health, and a major role for sub-national governments (states, cities). When the Constitution of India was drafted, it largely reiterated this design.


The changes after independence came from two sources; the shift of power to the union government, and adoption of the Bhore Committee report. While the Constitution envisioned a federal arrangement, in practice, power shifted to the union government after independence. The union government designed programs, and financed state governments to implement these programs. There was a consequent atrophying of policy thinking and execution at the state and local government level. This had an impact on many aspects of public policy in India. In the present context, there was an adverse impact upon public health, as a large part of the field of public health consists of local public goods.

The Bhore committee report shifted focus from public health to health care, and gave a leadership role to doctors in health policy. It was adopted by independent India and became the gospel for health system thinking in India. There is an interesting tension in Bhore Committee report, between its recognition of the need for public health as a distinct problem from health care:

 The health services may broadly be divided into (i) those which may collectively be termed public health activities and (ii) those which are concerned with the diagnosis and treatment of disease in general.

versus its emphasis on health care:

Preventive and curative health work must be dovetailed into each other if the maximum results are to be obtained and it seems desirable, therefore, that our scheme should provide for combining the two functions in the same doctor in the primary units. (Emphasis added).


This document was accepted into the thinking of the Planning Commission, and translated into schemes and outlays in the following decades. There was a large scale attempt at building a public sector health care system.

For many decades, this induced the main paradigm of Indian health policy: an emphasis on health care at the expense of public health, weaknesses in local government, a big role for the public sector in the production of health care, and domination of doctors in policy thinking.

This approach worked badly. By the early 1980s, some policy thinkers began questioning this framework. By the 1990s, a great deal of evidence and literature had accumulated, that criticised this approach. Weaknesses in public health were giving a high disease burden. Alongside this, the public sector health care system was not effective. An unregulated, private sector health care system sprang up, to respond to the requirements of the citizenry.

While the mainstream health policy establishment proposed intensification of effort within this paradigm, by spending more money on it, politicians became increasingly concerned that the paradigm was delivering poor results. On the ground, it was apparent that private sector health care was the dominant feature of Indian health care.

This led to the ideas of public funding for the purchase of private health care, implemented through health insurance companies. This approach was attractive as it appeared to more directly translate fiscal outlays into tangible benefits for citizens. This policy innovation, which began in Maharashtra in 1997, spread rapidly across the country. By early 2018, there were 48 Government Funded Health Insurance Schemes (GFHISs).

We argue that there are four areas of concern with this approach. The first problem is the lack of emphasis on public health. The most effective public policy interventions in health are the public goods of public health, which were introduced in the British period. It is an incorrect strategy to have a high disease burden in the first place, and then build a curative layer on top of it. It is better to clean the air than to produce health care services for sick residents.

The second concern is about the conduct of the largely unregulated private health care sector, which yields poor outcomes for citizens. This calls for establishment of a regulatory strategy for the health care industry.

The third concern is about the weaknesses of consumer protection and micro-prudential regulation of health insurance companies, which yields poor outcomes for citizens. This calls for reforms of the regulation of health insurance companies.

Finally, there are important fiscal risks in this journey. Once voters get used to entitlements, they are politically difficult to withdraw. Population-scale health care is expensive, particularly in the context of weaknesses in public health which are giving a high disease burden. This is analogous to the field of pensions, where decisions about pension reforms need to be made only after estimating the implicit pension debt over 75-year horizons. There is a need for greater fiscal analysis, and caution, in the construction of government programs in health which make promises to households about future health care expenditures.


The authors are researchers at the National Institute of Public Finance and Policy.

Tuesday, November 13, 2018

There be dragons: Off-balance-sheet liabilities of the Indian State

by Ila Patnaik and Ajay Shah.

Conventional fiscal stability analysis looks at the stock of debt and wonders whether a country can pay off this debt, under reasonable scenarios for future interest rates and fiscal surpluses. In many countries, though, the fiscal sustainability story has turned on promises made by a government which were not explicitly counted in the debt. There are obvious liabilities that are kept off the books - such as debt in public sector companies or state electricity boards. In this article we look deeper, at less obvious ways in which off-balance-sheet liabilities have arisen, and the checks and balances that can contain them.

Off balance sheet liabilities of the government


Off balance sheet items come in two kinds.

  1. A promise that looks like the cashflows on a bond. Example: A pension promise to a person is no different from a series of coupons that are paid out every year. Promising a pension is exactly like issuing that comparable bond.
  2. A promise that looks like an option payoff. Example: If a government is in hock to pay the lenders of a firm when it goes bankrupt, it is much like being the seller of an option. When governments write guarantees, this changes the risk profile of the exchequer and generates possibilities of large payouts when those options mature in the money.
    It should be noted that organisations backed by statute are not automatically backed by a government guarantee. As an example, in the UTI crisis of 2001, the government had no legal obligation to make good the losses of investors, but a political decision was made to use fiscal resources to pay half the loss. There is a mixture of financial risk ("Will X get into trouble?") and political risk ("Will the government backstop X?").

A correct reckoning of the liabilities of a government should add in these off-balance-sheet liabilities of both kinds. The FRBM Act brought control on one kind of off-balance-sheet liability of the Indian State: explicit guarantees given by the government. But there is more to the problem of off-balance-sheet liabilities than explicit guarantees.

Differences in cost versus differences in transparency


In the field of pensions, an interesting distinction is made between an unfunded defined benefit program vs. a funded defined benefit program that has assets invested in government bonds. In the conventional wisdom, a funded DB program is always superior to a pay-as-you-go unfunded program.

However, these two approaches are exactly the same in terms of the cashflows: both involve a highly predictable set of claims on the exchequer at future dates. To promise a pension is to implicitly issue a bond. This equivalence, between the cashflows of a bond and the cashflows of a pension, has an interesting implication. Consider a funded DB public pension program that invests in government bonds. The two streams of cashflows cancel out.

This approach to funding (holding government bonds) does not make things cheaper: it is only superior in that it is transparent and connects into the fiscal planning process. Cost savings only come about when a funded DB program invests in higher return assets, such as equities, through which the claims upon the exchequer at future dates are reduced on expectation.

What are the important off-balance-sheet liabilities of the Indian State?


Some important components of the off-balance-sheet liabilities are:

  • Promises made for defined benefit pensions of civil servants, in particular the new `one rank one pension' (i.e. wage indexed) pensions for uniformed folk, and the underfunded `Employee Pension Scheme' (EPS) that is run by the EPFO. For the civil servants recruited after 1/1/2004, there is no such problem, as these new recruits are in the New Pension System.
  • Promises made in a variety of health-related entitlement programs (Patnaik et. al., 2018).
  • The temptation to make good the promises made by public sector financial firms, that experience distress in the future, even when there is no explicit guarantee. Of these, LIC has a balance sheet of Rs.28 trillion.
  • The temptation to make good the promises made by private financial firms that experience distress in the future, even when there is no explicit guarantee. As an example, will the failure of IL&FS -- a private financial firm -- induce a direct or indirect fiscal impact upon the exchequer? So far, the government has not put money on the table, but could this change?
  • The use of fiscal resources in responding to a full blown financial crisis, that may occur at a future date.
  • The Parliament has enacted many laws, which could potentially evolve into large inflexible expenditures. These include `Right to education', `Right to food' and NREGS. On a similar note, the promises which are being made under `minimum support price' (MSP) could turn into large expenditures if the future brings together a certain combination of political pressures, jurisprudence and development of State capacity. Until repeal, these laws are a genotype that could, under the right combination of events at future dates, get expressed in a way that involves major fiscal risk.

These liabilities add up to large sums of money, of the same order of magnitude as the overt stock of public debt. Hence, off-balance-sheet liabilities should become more prominent in the Indian fiscal discourse.

How do the incentives of politicians and officials change?


At present, there is no check-and-balance influencing these opaque promises and risks. Each party in power looks to enter into greater off-balance-sheet obligations so as to get re-elected. How might this change?

The key thing that shapes these incentives is financial repression. At present, government debt is mostly sent into involuntary lenders. When the fiscal system graduates from financial repression to voluntary lenders, off-balance sheet liabilities would matter. There are numerous gains from removing financial repression: voluntary borrowing is more efficient than forced borrowing, the magnitude of resources available in a crisis would become greater, etc. But this requires a government that faces a skeptical bond buyer who demands a risk premium based on the extent to which the Indian State may engineer inflation or default.

In India today, there are many loose ends, which periodically induce fiscal surprises. This creates an adverse risk profile of Indian government bonds, and would drive up the required interest rate for borrowing when faced with voluntary buyers of bonds. In such a world of market discipline, when a government dips into LIC's resources, this would induce a higher cost of borrowing.

In India today, most of the attention in fiscal reforms lies upon tax policy reforms, such as the GST and the Direct Tax Code, and there is some interest in FRBM. There is much more to a mature fiscal system, including the issues of tax administration, debt management, the bond-currency-derivatives nexus, off-balance-sheet liabilities, accrual-based accounting, and the budget process. We need to broaden our research and policy work to address this full range of problems.

Tracking and understanding off-balance-sheet liabilities, communicating them to lenders, and communicating these concerns back into the budget process, is part of the work program of the future Public Debt Management Agency (PDMA) (Pandey and Patnaik, 2017). A Fiscal Council will help. Accrual based accounting will help.

Once we start paying attention to off-balance-sheet obligations, this creates fresh impetus for economic reform in many areas. As an example, if a monsoon failure induces a farm loan waiver paid for by the government, this is like a monsoon derivative that has (maybe) been written by the government. When reforms of personal insolvency and reforms of agriculture remove this possibility, the risk profile of the Indian exchequer will improve, and the cost of borrowing will go down.

Off-balance-sheet liabilities and financial reform


There is a close connection between public finance and finance, centering around the government bond market and the PDMA. For public finance, PDMA and the government bond market are the source of debt. For finance, the PDMA is the biggest investment banker of the country and the government bond market is the tool for low risk transfers of resources across time. What is less widely noticed is the intimate connection, between public finance and finance, through the question of off-balance-sheet liabilities.

How will off-balance-sheet liabilities change when micro-prudential regulation improves and the resolution corporation is setup? Financial firms will face distress less often, we will discern that distress early, and we will have an institutional mechanism to put the distressed firm down. Conversely, under present conditions, we get surprised by the difficulties in an IL&FS or in a UTI. These crises lead to a political question being thrust upon the leadership: Will you make liability-holders happy by using taxpayer money? We should, of course, have a mature political system which is able to turn down such requests most of the time, but we should have a mature financial regulatory system so that these situations do not arise in the first place.

Governments worldwide have faced claims on fiscal resources when dealing with full blown financial crises. The probability of occurrence of such crises, and the severity of such crises, is shaped by the institutional capacity in systemic risk regulation. The FSLRC apparatus for systemic risk regulation -- the Financial Stability and Development Council (FSDC) and its information system, the Financial Data Management Centre (FDMC) -- will reduce fiscal risk and thus the cost of government borrowing. As an example of the work program which should take place through FSDC/FDMC: At present, we have the possibility of runs on mutual funds (Sane et. al., 2018), which can lead to a full blown financial crisis, which requires policy thinking and reforms on a financial system scale.

Our objective in financial economic policy should be: to be as sparing as possible in ever asking for resources from public finance policy. For a sound fiscal system, we require financial sector reform. This will have a beneficial impact upon contingent off-balance-sheet liabilities and thus the cost of borrowing.

The need for a research community and a research literature


A remarkable feature of the existing Indian policy process is that no fiscal estimation was done in the policy process that led up to the announcements  about one rank one pension, or the various health insurance programs.

Even if policy makers had tried to reach into the research community to obtain such estimates, the state of data and knowledge is weak, and it is difficult for policy makers to obtain policy support from researchers. Some early work on the civil servant's defined benefit pension (Bhardwaj and Dave, 2005), one rank one pension (Sane and Shah, 2015) and banking (Shah and Thomas, 2000) is available. Much more needs to be done in this important field.

In an ideal world, record level data would be available from the government which would permit estimation of the value of the implicit debt or the implicit derivatives that the government has issued. The state of information systems and transparency of government is often a bottleneck, and creative research strategies have to be employed. As an example, Bhardwaj and Dave, 2005, utilise data from a national scale household survey to identify present and future beneficiaries of the traditional DB civil servants pension, and extrapolate the sample estimates to an estimate of the implicit pension debt associated with the traditional civil servant's DB pension. Similarly, Shah and Thomas, 2000, exploit information in stock prices to estimate the equity capital gap in banks, which helps overcome the opacity of banks and banking regulation.

A research community is required, which will build a research literature in estimating these expenditures based on exploiting diverse datasets. There will, of course, be multiple different estimates, as different researchers search for useful approximations through different assumptions and modelling strategies. A coherent picture will emerge from these debates. The PDMA, and buyers of government bonds, will be important users of this research community.

Off balance sheet liabilities and GDP growth volatility: A conjecture


There is a big gap between short spurts of GDP growth and sustained GDP growth. A mature market economy is a turtle, it plods along for a century, obtaining a low rate of growth on average, and harnessing the power of compounding. Poor countries fail to get sustained growth. The striking fact in cross-country comparisons is how volatile the GDP growth of poor countries is.

What might be going on? An analogy from a different field is useful. A well known problem in financial portfolio management is the returns that can be obtained, in the short term, by selling out-of-the-money options. For some time, the option seller seems to make a lot of money. But in time, some of those options get exercised and the portfolio gets into a lot of trouble. In similar fashion, for some time, a government that takes on option-like off-balance-sheet liabilities can gain votes and possibly accelerate economic activity, at the cost of sustainability.

Perhaps one element of the high GDP growth volatility of poor countries runs as follows. Mature fiscal systems create checks-and-balances which reduce the extent to which debt or off-balance-sheet liabilities can surge. Perhaps less developed countries have weak institutions, and then the political leadership sees a different optimisation. Short bursts of GDP growth can then be achieved in many bad ways, such as a surge in debt, piling up off-balance-sheet liabilities, etc. But this is not sustained growth: We get a spurt of high growth, and then things go wrong. This yields one more element of the translation of bad institutions into high GDP growth volatility.

References


Bhardwaj, Gautam and Surendra A. Dave, 2005. Towards estimating India's implicit pension debt, Working paper.

Pandey, Radhika and Ila Patnaik, 2017. Legislative strategy for setting up an independent debt management agency. NUJS Law Review, 10(3).

Patnaik, Ila, Shubho Roy and Ajay Shah, 2018. The rise of government-funded health insurance in India. NIPFP Working paper.

Sane, Renuka and Ajay Shah, 2015. What is the cost of one-rank-one-pension? The Leap Blog.

Sane, Renuka, Ajay Shah, Bhargavi Zaveri, 2018. Runs on mutual funds, The Leap Blog.

Shah, Ajay and Susan Thomas, 2000. Systemic fragility in Indian banking: Harnessing information from the equity market. IGIDR Working Paper.


The authors are researchers at the NIPFP in New Delhi. We are grateful to Shubho Roy, M. Govinda Rao and Arbind Modi for useful discussions.

Monday, August 06, 2018

Diagnosing and overcoming sustained food price volatility: Enabling a National Market for Food

by Anirudh Burman, Ila Patnaik, Shubho Roy, Ajay Shah.

We have a new paper, Diagnosing and overcoming sustained food price volatility: Enabling a National Market for Food, on the difficulties of Indian agriculture, and an implementation strategy for achieving a national market for food.

The problems of Indian agriculture


High food price volatility is a persistent difficulty of Indian agriculture. Policy responses have ranged from restricting or liberalising exports or imports, increasing or decreasing procurement and procurement prices. We conjecture there may be an element of Samuleson's Cobweb model at work, where high output leads to a crash in prices, that causes producers to reduce output, leading to a spike in prices.

The food market today is characterised by many small-to-medium producers, cartelisation, complicated administrative and legal structures that pre-date the economic reforms of 1991, and monopoly of, and intervention by, the State. The restrictions in the Indian agricultural economy hinder an efficient transmission of price signals from consumers to producers. Hence, the system teeters between boom and bust.

Restrictive policies and administrative bottlenecks have given a low elasticity of supply. Very high changes in prices are required to clear small gaps between supply and demand. With respect to most other goods and services, India has graduated into a normal market system, with the progressive removal of administrative and fiscal barriers to their trade within India. This allows for a normal transmission of information regarding demand and supply. This has not happened in agriculture.

The four missing elements


The solution strategy lies in four foundations of agricultural markets:

Warehousing
With well functioning storage, food could be transmitted from one time point to another, thus reducing the peaks and troughs of prices.
Futures markets
Well functioning futures markets can give guidance to private persons on decisions about sowing and storage.
International trade
The world market can act as a buffer stock: when there is a glut in India, food would be exported, and vice versa.
National market
A national market is required to achieve smoothing between the large number of micro-markets within the country. Food would move from areas with high output to areas with low output.

Our paper focuses on the implementation strategy for the fourth element, the national market.

Building a national market


Unlike other commodities, agricultural products cannot be transferred freely throughout the country without being subject to state-specific restrictions. Markets in agricultural food products are governed by legal requirements or restrictions which were put in place with the intention of creating markets (such as APMCs) but have had the effect of keeping markets non-competitive, segregated and localised. For most other commodities, there are no restrictions on who can purchase or sell goods. Usually, a simple registration under the shops and establishment laws allows for trade in all consumer goods. The present provisions and rules of any APMC laws enact and enforce similar rules for agricultural products.

In recent years, state governments have made gradual progress towards removing some of these barriers. A number of states including Meghalaya, Uttarakhand, Haryana, Assam and Andhra Pradesh, recently issued notifications delisting fruits and vegetables from their respective APMC laws. Bihar, Kerala, Daman and Diu, Lakshwadeep, Andaman and Nicobar islands, Manipur and Dadra and Nagar Haveli have no APMC Acts. Bihar repealed its APMC Act in 2006 and privatised its agricultural marketing infrastructure.

These reforms are, however, incremental and do nothing to remove the legally mandated monopsonies in the food market. These reforms are narrowly targeted at removing food products out of the ambit of APMCs rather than enabling a competitive national market.

While most scholars agree that a national market in food is essential, it is generally felt that this will require an agreement between all or most state governments. This is considered a difficult challenge, as the GST negotiation shows.

Our analysis shows that the process of creating competitive local markets in food markets can be done by the Union Government using its powers under the Constitution of India. By doing so, the Union Government can create the legal infrastructure for an integrated national market for food. This would override the existing framework currently in place for most states. This policy strategy requires no coordination with state governments.

Legal analysis


Article 301 of the Constitution states that trade and commerce throughout India shall be free, while being subject to reasonable restrictions imposed in the public interest. At present, the following restrictions exist in the food market:

  1. Legal restrictions placed by states: APMC laws, storage limits, and other legal requirements that promote oligopsonies with cartels of buyers.
  2. Technical barriers to trade: checks placed on APMC borders, checks placed on state borders, etc.

Achieving a national market requires removing these constraints.

Article 301 of the Constitution of India, along with entries in the Seventh Schedule of the Constitution grant the Union Government the power to do both: (a) Regulate all inter-state trade and commerce, and (b) regulate intra-state trade and commerce in, and the production, supply and distribution of "foodstuffs including edible oilseeds and oils." (List I Entry 42, List II Entries 26 and 27, and List III Entry 33) The Central Government can use these powers to create an integrated national market by removing limits and restrictions placed by APMC laws, and by creating institutional mechanisms to continuously identify and review administrative barriers to trade in the food market.

The creation of a national market in agriculture is thus something which is feasible for the Union government without requiring a complex negotiation with state governments.


The authors are researchers at NIPFP, Delhi.

Monday, April 30, 2018

Fair play in Indian health insurance

by Shefali Malhotra, Ila Patnaik, Shubho Roy and Ajay Shah.

India's National Health Protection Scheme (NHPS) aims to be the world's largest government-funded health insurance programme. As in the existing government-funded health insurance schemes, health insurance companies are likely to play a crucial role in the implementation of NHPS. In addition, the number of Indians purchasing health insurance (on their own) has grown in the past few years. Of the total out-of-pocket expenditure (80% of the total health expenditure), payments for health insurance premium have increased from 5.28% in 2013-14 to 6.51% in 2015-16. However, all is not well in this growing industry. This has raised concerns of fair play and efficiency in the industry.

While there is some literature on consumer protection concerns in the overall insurance industry, the existing literature on the health insurance industry in India is sparse. In a new paper, Fair play in Indian health insurance, we study the functioning of this industry through an analysis of the claims ratio and the complaints rate.

Efficiency in the insurance market is commonly measured through the claims ratio. The claims ratio is defined as the percentage of the total premium collected that is paid out as claims by an insurer. Claims ratio close to (but less than) 100% indicates that the insurer is efficient (low operating costs). Claims ratio above 100% indicates that the insurance company is paying more than it is collecting as premium. This implies that the insurance company is unsustainable and may go bankrupt. When the claims ratio is too low, there are concerns about consumer protection. It indicates that the insurer is charging too much from the consumers. Figure 1 shows the range of claims ratio that insurance regulators use as an indicator for the insurer's quality.

Our analysis of the claims ratio shows that the functioning of the Indian health industry is neither desirable nor sustainable. A part of the industry, the private stand-alone health insurers, appear to be overcharging its consumers. Between 2013 and 2016, the claims ratio of these insurers fell from 67% to 58%. Such low claims would have triggered mandatory refunds if these insurers were operating in the US. However, there are no regulations mandating minimum claims ratio in India. Another part of the industry, the government insurers, suffers from financial fragility. Group insurance businesses and government-funded health insurance schemes also raise concerns related to insolvency. We conclude that the evidence from claims ratio raises concerns about consumer protection and micro prudential regulation.

In addition to the claims ratio, the complaints rate is used to measure the quality of products in the insurance industry. The complaints rate is the number of complaints made by consumers of insurance (to a third party) in a year per million persons covered. Our analysis of the complaints rate shows that India has the highest complaints rate when compared with other common law jurisdictions: Canada, Australia, UK and California. This finding is probably conservative for two reasons. First, unlike other jurisdictions, Indian health insurance only covers hospitalisation. In addition to hospitalisation, other jurisdictions provide clinical visits, medication and some wellness care under health insurance. Thus, increasing the number of touch points and transactions, where failures can generate complaints. Second, India is a less litigious country than other jurisdictions. So, we must adjust the Indian complaints rate with the litigation rate (civil suits filed per hundred thousand persons). Table 1 is our estimation of the complaints rate in India and the compared jurisdictions for 2015-16. The last column is our estimation of India's litigation rate adjusted complaints rate (Column 3).

Table 1: Complaints rate for the year 2015-16 (Source: Authors' calculation)
Country Complaints rate India's
complaints
rate
(2015-16) (Adjusted)
India 360.72 -
Australia 178.51 1607.48
Canada 11.53 1511.81
UK 337.54 3837.44
California 351.19 6052.34

Putting these two factors together, we view the complaints rate that prevails in the Indian health insurance industry as a source of concern. We also read a large number of court orders settling health insurance disputes. One common thread which stood out was the absence of complexity in these disputes, most relating to arbitrary and illegitimate rejection of claims by the insurers.

When we investigate the sources of these problems, they are traced to infirmities in the regulatory framework governing the health insurance industry. We identify three issues in the regulatory framework. The first issue is deficiencies in the existing regulations. For example, the regulations are not clear on disclosures that insurance companies should make to its consumers, the manner in which disclosures should be made and the procedure for settlement of claims. The second issue is poor enforcement of existing regulations. The insurance regulator and the insurance companies seem to easily bypass their obligations under the regulations without any repercussions. The third issue is fundamental deficiencies in the design of the insurance ombudsman, in so far as its offices and day to day administration is controlled by the insurance industry. We then engage in a comparative law analysis, where each of these issues is analysed with respect to the legal systems of Australia, South Africa, US and UK.

Finally, we turn to existing strategies for reform in the Indian insurance sector. Financial Sector Legislative Reforms Commission, provides insights into the approach to consumer protection for financial services. The report comprises of two volumes. Volume I is "Analysis and Recommendation". Volume II is the "Indian Financial Code", a model law for the regulation of the financial sector. We engage in counter-factual analysis of the three identified issues in a hypothetical world, where the Indian Financial Code was enacted. We find that all the three issues are suitably addressed. We conclude that the Financial Sector Legislative Reforms Commission, provides an intellectual framework through which the problems of health insurance can be understood and solved. Implementation of these measures will have positive implications for health insurance in India.


The authors are researchers at the National Institute of Public Finance and Policy.

Saturday, May 27, 2017

Improved measurement of Exchange Market Pressure (EMP)

by Ila Patnaik, Josh Felman, Ajay Shah.

Exchange rates vs. exchange market pressure


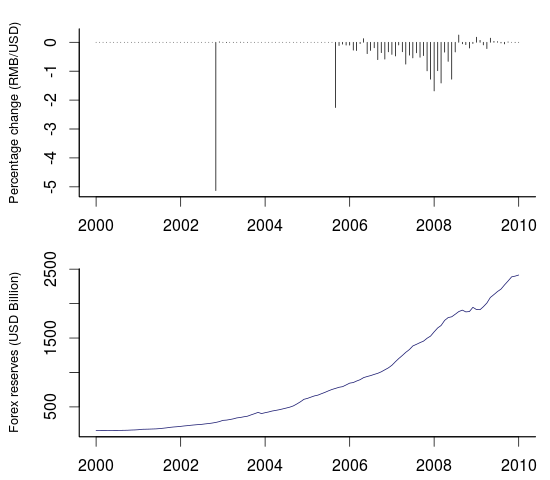
Changes in the exchange rate are very visible. But is the apparent change in the exchange rate a fair depiction of the pressure on the currency market? As an example, consider China's story with the exchange rate:

Figure 1: China's monthly exchange rate returns (upper) and foreign exchange reserves (lower)

The upper panel is monthly returns on the CNY/USD. Positive returns are depreciations and vice versa.  We see large periods of zero change separated by a few months in which there was an appreciation. Does this mean that in the long periods of zero change in the exchange rate, the currency market was quiescent? No. This is a period in which the Chinese central bank was trading in the currency market on a large scale. As the graph of their foreign exchange reserves shows, they went from \$0.4T in 2004 to \$1.9T in 2009. There was a lot of pressure on the currency to appreciate. What we see, as zero or small negative returns, understates the true story.

In order to address this problem, economists aspire to construct a measure of `exchange market pressure' (EMP), which would show the true conditions on the currency market in each month. To borrow a phrase from Amit Varma's podcast, there's an important difference here between the seen and the unseen. The apparent exchange rate change is what we see. What's really going on, in terms of the macroeconomic situation on the currency market, is the exchange rate pressure.

Conventional thinking in EMP measurement


Attempts at EMP measurement have been in progress since Girton and Roper, 1977. There are many EMP measures in the literature. An important one, which expresses the mainstream strategy, is by Eichengreen et. al., 1996 . They propose an EMP index for a country is given by:

\[
\textrm{EMP}_{t} = \frac{1}{\sigma_{e}} \frac{\Delta e_{t}}{e_{t}} - \frac{1}{\sigma_{\bar r}} \left ( \frac{\Delta \bar r_{t}}{\bar r_{t}} - \frac{\Delta \bar r_{US_t}}{\bar r_{US_t}} \right) + \frac{1}{\sigma_i} \left (\Delta \left (i_{t} - i_{US_t} \right) \right)
\]

Where the exchange rate is denoted by $e_t$, reserves divided by base money is $\bar r_t$ and intervention of the central bank at time $t$ is $i_t$. The change in $e_t$ is denoted by $\Delta e_t$; the change in $\frac{r_t}{m_0}$ is denoted by $\Delta \bar r_t$. The three sigmas, $\sigma_e$, $\sigma_{\bar r_t}$, and $\sigma_i$, denote the standard deviations of the relative change in the exchange rate, difference between relative changes in the ratio of foreign reserves and base money in the home country against the reference country (US), and the nominal interest rate differential.

This EMP measure is essentially a weighted average of changes in exchange rate, foreign exchange reserves, and interest rates. To prevent the most volatile component of the index from dominating (usually the forex reserves), each component is weighted by its standard deviations. The resulting EMP index is dimensionless. There is a literature (Pentecost et. al., 2001, IMF.,2007) which finds that these kinds of measures are useful in forecasting currency crises.

Problems with conventional EMP measurement


This approach to measurement has several problems. When there is a fixed exchange rate, the standard deviation in the denominator goes to zero. When a country with an inflexible rate (low $\sigma_e$) experiences a modest change in the exchange rate, this shows up as a large value of EMP. As an example, consider the Chinese experience in the time period covered in Figure 1:

Figure 2: Conventional EMP measure for China

In some months, it is not possible to compute the EMP as we get a divide by zero. In other months also, the graph above does not square with our understanding of what was going on. As an example, consider the period after the Lehman collapse. The EMP measure seems to suggest that this is where the highest pressure to appreciate was seen, which seems incorrect.

A better EMP measure


A recent paper, Patnaik et al., 2017 introduces a new method for measurement of EMP. This new approach seeks to measure EMP in the units of percentage change of the exchange rate of the month. The EMP reported for a month is an estimate of the unseen - the exchange rate change (measured in per cent) which would have taken place if there had been no currency intervention in that month.

Let's treat this new method as a black box and examine how well it works.

Example: EMP in China


Figure 3: Conventional vs. new EMP measures for China

The figure above juxtaposes the conventional EMP measure against the new proposed measure.

There are two gray blocks in the conventional measure, where EMP can't be computed as it was a fixed exchange rate and we encounter the divide by zero. The new measure has no such problem.

In the long period of pressure to appreciate, the new measure shows an interpretable value such as a 5% appreciation in the month, which would have taken place if there had been no trading by the central bank in the currency market. The conventional EMP index is dimensionless and cannot be interpreted in similar fashion.

At the Lehman crisis, the new measure shows a sudden shift in exchange market pressure, followed by a return to the pressure to appreciate. The conventional measure suggests the highest ever pressure to appreciate was found at the time of the Lehman crisis, and this pressure subsided later.

Example: EMP in India


Figure 4: Conventional vs. new EMP measures for India

For macroeconomists who know the Indian experience closely, the new measure makes a lot of sense.

In early 2007, it is rumoured that RBI was purchasing as much as \$1B a day, and there was very high pressure to appreciate prior to the structural break in the exchange rate regime on 23 March 2007. This shows up correctly in the new measure. The conventional measure, in contrast, thinks there was not much going on then.

The conventional measure seems to say that at the Lehman crisis, there was a switch from depreciation pressure to appreciation pressure. This seems unlikely. The new measure shows the highest-ever pressure to depreciate right after the Lehman crisis. This seems correct.

Example: EMP in Russia


Figure 5: Conventional vs. new EMP measures for Russia

There was a long period (2002-2008) with one-way pressure to appreciate. This is picked up in the new measure but not in the conventional measure.

The Russian invasion of Georgia (08/08/08), followed by the Lehman shock in the next month, are associated with an immediate shift to depreciation pressure in the new measure (from August itself, reflecting the Georgia invasion). The conventional measure does not pick up these events correctly.

The Russian invasion of Crimia is followed by pressure to depreciate, in the new measure. This does not appear as clear in the conventional measure.

Example: EMP in Brazil


Figure 6: Conventional vs. new EMP measures for Brazil

The Lehman failure, and the Taper tantrum, show up as episodes of pressure to depreciate in the new measure but not in the conventional measure.

Conclusion


Exchange market pressure is an important tool for better understanding macroeconomics. While the concept has always been attractive, conventional methods for measurement have had limitations. The new measure makes it possible to take interest in EMP as a tool for macroeconomic analysis. This article aims to unveil the new measure as a black box, to show that it works better than the conventional measure. The methodology is presented in the underlying paper. The resulting dataset, with monthly EMP data for 139 countries, has been released, and has diverse potential research applications.

Bibliography


Eichengreen, B., Rose, A., Wyplosz, C., 1996. Contagious Currency Crises , Technical Report. National Bureau of Economic Research.

Patnaik, I., Felman, J. and Shah, A., 2017. An exchange market pressure measure for cross country analysis . Journal of International Money and Finance, 73, pp.62-77.

Desai, M., Patnaik, I., Felman, J. and Shah, A., 2017. A cross-country Exchange Market Pressure (EMP) Dataset . Data in Brief.

Pentecost, E., Van Hooydonk, C., Van Poeck, A., 2001. Measuring and estimating exchange market pressure in the EU . J. Int. Money Finan. 20, 401¡V418.

IMF, 2007. Managing Large Capital Inflows , Technical Report. International Monetary Fund.

Thursday, February 16, 2017

Monetary policy strategy for 2017

by Ila Patnaik and Ajay Shah.

India now has an inflation targeting central bank and a monetary policy committee. The first three monetary policy committee meetings have taken place. The first meeting cut the de jure policy rate, and the next two meetings chose to hold.

Winston Churchill once said If you put two economists in a room, you get two opinions, unless one of them is Lord Keynes, in which case you get three opinions. However, all the three meetings of the MPC featured six economists with one opinion.

In this article, we argue that conditions in the economy suggest that it is time to worry about forecasted inflation going closer to the low end of the target range.

Let's start at the measure of inflation that is used in defining RBI's objective, i.e. the year-on-year change of CPI:

Headline inflation, i.e. year-on-year CPI inflation

Y-o-y CPI inflation breached 5% in February 2006. After that, we had a long and painful bout of inflation. A recession began in India in 2012, and by mid-2013, inflation was on the decline. The latest value, for January 2017, shows 3.17%. This is benign when compared against the range from 2 to 6 per cent, which is coded into the RBI Act.

Each reading of year-on-year inflation is the average of twelve changes for the latest twelve months. To understand what is going on in the economy in recent days, it's useful to look at month-on-month changes. This requires seasonal adjustment. We have developed the models for seasonal adjustment at NIPFP, and will use this ahead.

Roughly half the CPI basket is food and food inflation is thus critical for the overall CPI. What is going on with food inflation? We use the WPI Food to look at this:

Month-on-month WPI Food inflation (SA, Annualised)

The values above are annualised month-on-month changes of seasonally adjusted WPI Food. This shows that from July onwards, we have had remarkably low food inflation. The CPI inflation that we have got stems from non-food inflation. Looking forward, the outlook for non-food inflation is limited because of softness in global prices of tradeables.

The poor man's statistical model of y-o-y CPI inflation is to forecast the m-o-m values using univariate time-series methods, and add up the latest 11 facts with 1 forecast to get a one-month ahead forecast. When we do this, the forecasts for February, March and April work out to 3.32%, 3.65% and 3.43%. These benign forecasts use no economic knowledge - they only reflect the time series structure of month-on-month inflation. These should be treated as the baseline on top of which we layer on economic thinking.

What about pressures on aggregate demand? There are four perspectives which suggest that the demand side will be weak in 2017 and 2018.

  1. Exports growth is faring badly, partly owing to the difficulties of the global economy. The outlook for the global economy is poor, given the difficulties in China, Europe and the US.
  2. From November 2016, we have been adversely affected by the demonetisation shock. We estimate that demonetisation induced a median -0.45 sigma shock to month-on-month seasonally adjusted changes in 27 macroeconomic series for November 2016, and a -0.15 sigma shock for 24 macroeconomic series in December 2016. For a comparison, when our surprise measurement methods are applied to 2008, we estimate there was a -0.25 sigma shock in September 2008 and a -0.44 sigma shock in October 2008. Demonetisation has adversely affected optimism of households. We expect that demonetisation will exert a sustained negative impact upon the economy through 2017.
  3. Investment in India is faring poorly. The best measure of investment activity is the stock of projects classified as being `under implementation' in the CMIE Capex database. This stalled -- in nominal rupees! -- in 2012 and has not grown for five years. Things are likely to worsen on this front in the aftermath of demonetisation.
  4. We are in the midst of a banking crisis. In December 2016, non-food credit grew by 5.32% nominal when compared with December 2015, which is 1.91% in real terms. The last time we saw lower values was at the time of the Lehman crisis in late 2008.

These four problems are, of course, inter-related. We overstate the gloom when we think of them as four orthogonal issues. Each of the four is a difficult problem which resists quick solutions. As an example, consider the time series of cash in circulation:


Cash in circulation (Trillion rupees)

If you extrapolate the straight line at the end, it will be many months before cash is back to pre-shock conditions. Similarly, consider the year-on-year changes of imports by the US from China:

Imports by the US from China

It is remarkable to see that the recent low value was as bad as that seen in the 2008 crisis. The sluggish values here bode ill for global demand for Indian exports.

These four difficulties suggest that output and inflation will evolve in a more negative way as compared with the baseline statistical forecasts described above. In this case, CPI inflation outcomes could be knocking on the lower end of the target range.

We feel that these issues will weigh on monetary policy in 2017 and 2018. Monetary policy acts with a long lag, so we have to look ahead when thinking about policy changes today. Further, monetary policy in India is relatively ineffectual, as the monetary policy transmission is weak. Mere 25 bps changes have little impact. When monetary policy in India has to move, large moves are required. We feel that substantial reductions of the short rate are required in 2017 in order to stay at the inflation target of 4%.


The authors are researchers at the National Institute for Public Finance and Policy.

Tuesday, January 24, 2017

The RBI board: Comparison against international benchmarks

by Ila Patnaik and Shubho Roy.

Transparency and governance in central banks

There is renewed debate about the working of the RBI board, after the demonetisation decision. In a recent article in the Indian Express, we linked the observed outcomes to the faulty institution that is the RBI board. The Public Accounts Committee (PAC) of Parliament has questioned the Governor about the role of the board. At a conceptual level, Parliament, controls the functioning of the executive and other statutory bodies through two steps:

  1. Making laws that govern the executive or statutory bodies (such as RBI, SEBI, etc.); and
  2. Reviewing, through the committee system, whether such bodies are acting in accordance with the law.

An institution, as an inanimate object, does not have a human personality; it cannot reflect on its actions and change its behaviour. Rather, an institution's DNA is the law that governs it. When this institution functions in an unexpected way, one must look at the legal structures governing it.

For example, in 2013, a series of unexpected corporate scams starting with Satyam rocked India. These created fresh urgency for Parliament to amend the Companies Act (1956) to address the issue. We did not stop at discussing whether Mr. Raju was a good person or a bad person; we went deeper and changed the Companies Act in ways that make such a crisis less likely.

RBI's Central Board controls the functioning of the body corporate, i.e. RBI itself. Hence, the sound functioning of RBI requires sound functioning of its board. The RBI Act (1934) determines the working of RBI's Central Board. Hence, we need to examine the RBI Act, and ask whether it features sound provisions for the working of the board.

In this article, we document how, when compared with similar laws in other jurisdictions, the RBI Act has many gaps in terms of transparency and accountability. Regulations are made by the Board to govern itself, which violates basic requirements of hygiene. The flaws in the RBI Act help us understand how the demonetisation event happened, and show the direction for reform.

Board transparency

RBI does not publish either the agenda or the minutes of any Central Board meeting. All that comes out is a press release. For a contrast, consider the Bank of England (BoE), which is grounded in the same legal tradition as India. It releases the minutes of every board meeting, 6 weeks after the meeting. This flows from the Financial Services Act of 2012 . These minutes go back historically, with minutes available for as far back as 1694. By this yardstick, RBI in 2017 lags the Bank of England of 1694.

Similarly in the U.S., the Federal Reserve Board (FRB) and numerous government entities are governed by a transparency law that is aptly called the Government in the Sunshine Act. This act lays down transparency and accountability measures that government regulatory bodies must comply with, covering both the way meetings of a regulator are conducted and how the regulator makes regulations. Board meetings are divided into two types of meetings, open meetings and closed meetings. For open meetings, subsection (a)(2) of the law mandates:

"every portion of every meeting of an agency shall be open to public observation."

Under this law, prior notice stating the meeting agenda must be given for every open meeting (Example). Accurate minutes or transcripts are published after each open and closed meeting (Example), and a live video is provided for open meetings. If board members knew that the nation was watching each word that they uttered, each would be more responsible.

To maintain confidentiality when required (such as in relation to commercially sensitive matters or pending investigations), some meetings are closed to the public. This provision can be easily abused to achieve opacity. Hence, the Government in the Sunshine Act explicitly specifies the following four procedural requirements before a meeting can be deemed secret:

  1. Ten clear criteria are provided under which a meeting may be closed. An item has to fall within this exhaustive list to justify closing a meeting. Public choice theory teaches us that the Agent, i.e. the agency, is biased in favour of opacity. Hence, this list of permitted exclusions should be controlled by the Principal, i.e. Parliament. The contents of this list cannot be modified either by the executive or the agency. As an example, the grounds for exemption under India's Right to Information Act are written into the law and cannot be modified by the executive (e.g. Ministry of Finance) or an agency (e.g. RBI).
  2. Public notice: Even when a meeting is closed, the agency must issue a public notice containg a suitably abridged agenda, and stating that it proposes to hold a secret meeting.
  3. Transcripts and minutes: The agency must maintain transcripts and minutes of closed meetings. Any agenda item discussed that does not meet the criteria closing the meeting is made available to the public. The rest of the proceedings are kept in order to be released once the reasons for confidentiality cease to exist.
  4. For parts of a meeting to be closed and minutes withheld, the majority of the entire membership of the agency (not just those present and voting) must vote in favour of each agenda item or portion of the meeting to be closed.

The working of RBI, which is coded in the RBI Act, 1934, is inconsistent with contemporary thinking in Indian public administration. As an example, six years ago, the Chief Information Commissioner ordered RBI to disclose minutes of the board meeting. Oddly, this instruction appears to have been ignored.

Quality of minutes

The purpose of maintaining public records of meeting discussions is to demonstrate that the persons appointed to positions of responsibility and power are discharging their duties with care and diligence. The most recent press release only records attendance, and provides a two line summary which reads:

The Board reviewed the current economic situation, global and domestic challenges and other specific areas of operations of the Reserve Bank of India.

Let us compare this against the equivalent institution, the Court of Directors of the Bank of England. They publish detailed minutes of each meeting. These minutes record attendance and, excluding confidential elements, report in detail the views of each member on various issues such as risk profile; supervision functioning; monetary policy report; financial stability report, etc.

Similarly, while minutes of a single meeting of the New York Federal Reserve Board are around 6000 words, and those of the BoE Court of Directors are around 2100 words, RBI's press release is 142 words long. This either shows that the Central Board does not deliberate, or that the deliberations are not being released.

Board Committees

Most Central Banks have created committees based on modern principles of governance. For example the Bank of England has the following committees written into the general regulations of the Bank of England:

  1. Audit and Risk
  2. Nominations Committee for promotions within the Bank
  3. Remuneration Committee for fixing pay
  4. Transaction Committee for large value transactions which are not in the ordinary course of business
  5. Sealing Committee to governing the affixing of official seal on Bank documents

These are in addition to committees mandated by law, such as the Monetary Policy Committee and the Financial Stability Committee. Similarly, the Federal Reserve Board, has created sub-committees to conduct specific functions:

  1. Committee on Board Affairs
  2. Committee on Consumer and Community Affairs
  3. Committee on Economic and Financial Monitoring and Research
  4. Committee on Financial Stability
  5. Committee on Federal Reserve Bank Affairs
  6. Committee on Bank Supervision
  7. Subcommittee on Smaller Regional and Community Banking
  8. Committee on Payments, Clearing, and Settlement

Each of these committees has specific terms of reference specifying their authority and duties. In contrast, apart from statutory committees, RBI's general regulations create one Committee of the Central Board. There is no risk committee; audit committee; remuneration committee, etc. Regulation 15 of RBI's General Regulations gives wide and sweeping powers to the Committee of the Central Board:

The Committee of the Central Board shall have full powers to transact all the usual business of the Bank except in such matters as are specifically reserved by the Act to the Central Government or the Central Board.

There is no provision for board committees with identified duties. The composition of the Committee is quite unusual. Regulation 10(i) if the General Regulations states:

A committee which shall be called the Committee of the Central Board, consisting of the members of the Central Board who may at the time be present in the area in which the meeting is held,

The quorum for the Committee of the Central Board is quite unusual. Regulation 10(ii) states:

Two directors of whom one shall be a director nominated under section 8(1)(b) or 8(1)(c) or 12(4) of the Act shall form a quorum for the transaction of business.

RBI has a sanctioned strength of 21 directors. However, only 10 are currently appointed. But, since the Committee of the Central Board can take most of the decisions with just two directors, the debate about the size and vacancies on the Board becomes moot. This committee can carry out all tasks, except those specifically allocated to the Central Board.

Financial Accountability

The RBI budget seems to suggest poor oversight. There is no evidence that the Central Board actually discusses the budget. While the RBI budget for 2014-15 was Rs.13,356 crore, evidence that the Central Board looked at expenditure items is lacking; a large budget was approved without any observation. In contrast, BoE releases detailed comments on its financial dealings. Discussing the draft annual report for 2013, the released minutes of the Court of Directors notes:

Mr Jones noted that the Accounts were likely to show an onerous lease provision of £24mn, reflecting the Bank's assumption of the unused space at Canary Wharf formerly occupied by the FSA, unless tenants could be found. Negotiations with several possible tenants were in train.

The Central Bank of Canada, among other disclosures, also provides a list of all contracts above CAD 100,000 every quarter. For example, in the 3rd quarter of 2016, Bank of Canada paid Diebold Company of Canada, a manufacturer of ATMs and security systems CAD 150,000.

Conclusion

Under the rule of law, agencies and persons should be judged against set principles of law. However, in India, Parliament has set very low standards of transparency and accountability in the RBI Act (1934). Parliamentary committees with the power to hold government agencies accountable is a healthy feature of democracy. However, with the present silences in the RBI Act, the current approach where the Legislature questions RBI's functioning is yielding inadequate outcomes.

The correct approach for the legislature is to first formulate a law mandating transparency and accountability, from the Central Board and the organisation. The draft Indian Financial Code addresses most of the current concerns. After that, Parliament it must conduct regular oversight meetings (through the parliamentary committees) to hold the agency accountable against the mandated standards.

Ila Patnaik and Shubho Roy are researchers at the National Institute of Public Finance and Policy, New Delhi. The authors thank Nelson Chaudhuri, and Sanhita Sapatnekar of NIPFP for their inputs.