by Harsh Vardhan.
"Financial market stability and the orderly evolution of the yield curve are public goods and both market participants and the RBI have a shared responsibility in this regard."
Shaktikanta Das, Governor, RBI, October 2020
"Right from October 2020, we have given explicit guidance to the bond market. We expect an orderly evolution of the yield curve, it cannot be otherwise,"
Shaktikanta Das, Governor, RBI, February 2021
As the Covid pandemic has ebbed, central banks across the world are withdrawing the extra-ordinary easy monetary policy that was followed by them since the onset of the pandemic. Reserve Bank in India (RBI) is no exception. A week ago, it took the extra ordinary step of convening an ad-hoc meeting of the monetary policy committee (MOC) to hike the policy interest rates by 40 basis points and also increase the cash reserve ratio (CRR) for banks to take out liquidity from the banking system.
As this “normalisation” of the monetary policy unfolds, its impact on the financial stability has become a matter of concern. The statements of the RBI Governor quoted above, reflect the concern RBI has on financial stability and the evolution of the yield curve. While financial stability is a broad, all encompassing term, evolution of the yield curve is a much more specific idea that can potentially be objectively assessed. In this article I try to assess the orderliness of the evolution of the yield curve over the last four years.
Yield curve describes the basis interest structure in the economy. As the central bank takes policy actions bonds markets reprice the yields and the shape of the yield curve changes. As a fundamental input to pricing of a wide array of assets, predictable and orderly evolution of the yield curve is indeed desirable. High volatility and unpredictability in the evolution of the yield curve, especially when the policy actions taken to normalise monetary policy and regain the GDP growth trajectory post the pandemic, could result in mispricing of financial assets. RBIs concerns and expectation of such orderly evolution are understandable.
In this article, I try to assess the orderliness of evolution of the yield curve. I use data on the yield curve for the 4-year period of 1 April 2018 to 10 May 2022 to empirically assess how the yield curve has changed during this period. To be clear, this article does not evaluate the merits of the RBI’s intent or efforts at managing the yield curve; it only attempts to empirically assess how the yield curve has behaved over this period.
Assessing the evolution of the yield curve:
While it is easy to understand why policy makers would want the yield to evolve in an “orderly” manner in response to policy actions, it is not very easy to define what exactly an orderly evolution means. Trading in government securities takes place every day where all types of financial institutions participate. Even the RBI, through its treasury operations and open market operations participates in the government bond market. The collective actions of all these players determine the prices of government bonds and hence the yield on them.
We could hypothesise orderly evolution to mean that the daily changes in the yields across the curve are smooth and stable. There are two parameters we can look at the describe such smooth and orderly evolution – the volatility of daily yield change and the correlation of changes in yields across varying maturities. If the volatility of daily change in yields remains low and the correlation of yield changes across maturities is high, then it would mean that the yield curve is moving with the policy rates, in a non-disruptive and predictable manner. Such a yield curve can be considered as evolving orderly. On the other hand, increased volatility of daily change and reduced correlation would signal increase in the “disorder” in the evolution of the yield curve.
Data and analysis:
The data for this analysis is the daily yields data on the 3 month treasury bills (T Bills), 1 year, 3, year, 5 year, and 10 year maturity government securities (GoI securities) from 01 April 2018 to 10 May 2022, a total of 993 trading days of data obtained from Bloomberg. Of these maturities the 10-year securities are the most liquid and provide data for every trading day. For the other securities there are days where there would be no trading and hence no data would be available. We consider the previous days yield to continue for such non trading days which means that the change in yields for such days is considered to be zero.
For the purpose of my analysis, I divide the data into 4 time periods as follows:
The first period is from 1 April 2018 to 11 February 2019 which can be called the "pre low interest rate" period. RBI started cutting policy rates from February 19 up until May of 2020. Hence this is the period of stable policy rates. This period has data for 215 trading days.
The second period is from 19 February 2019 to 31 October 2020 is the "downward policy rates and pandemic period" when policy rates were reduced regularly to hit the lowest rate of 4% of repo by May 2020. I extend the period to Oct 31,2020 as RBI clearly started focusing on orderly evolution from October onwards. This period gives us data on 411 trading days.
The third period is from 01 November 2020 to 31 December 2021 which starts with the date of RBI publicly announced its focus on orderly evolution of the yield curve and ends with roughly the end of the pandemic and the reopening of the economy. While the end date is admittedly somewhat arbitrary it coincides with global trend towards rising rates that started in January 2022. This period gives us data on 282 trading days.
The fourth and the shorted period is from 01 January 2022 to 10 May 2022 is the last period where Indian interest rates started inching up (along with interest rates across the world). It includes a few days of data post the surprise, out of turn policy rate hike in May 2022. This period has data on 85 trading days.
For each of these four periods, I compute the following:
- Daily change in the yields of each of the four maturity GoI securities.
- Average daily yield change and the standard deviation of the change in the daily yield which I use as the measure of volatility of the daily change.
- Correlation between yield changes of these 4 GoI securities.
Results:
Figure 1 below presents a chart of the daily yield change in these 4 securities over this entire period of little over 4 years and 993 trading days.
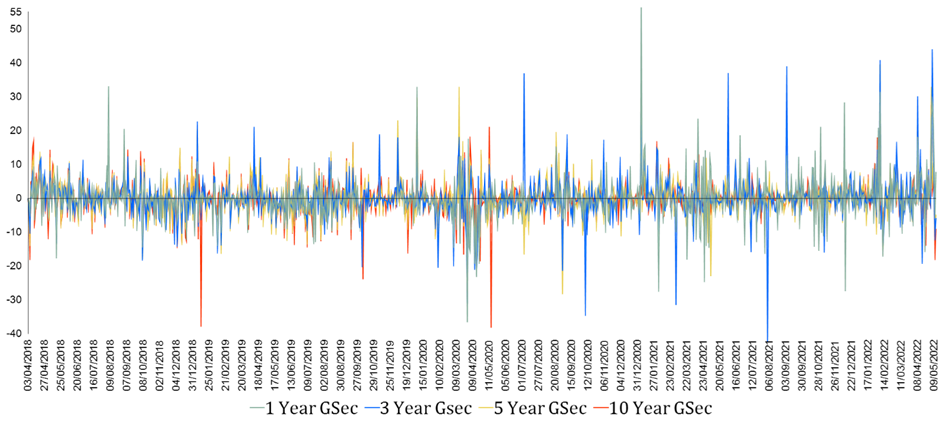
Source: Bloomberg, author’s analysis
Overall, the chart shows that the volatility of the daily change seems to go up with the onset of Covid in March 2020 with larger and more frequent spikes. This is especially true for the lower maturity; the 3 year and the 1 year maturity securities.
In order to understand the trends in the pattern of the daily change in yield, I plot the 30-day moving average of the daily change in yield as presented in Figure 2 below.

Source: Bloomberg, author’s analysis
Figure 2 clearly shows a pattern in the changes in the yield curve. The first period has much smaller change daily change in the curve and the changes across maturities are fairly highly correlated. The second period shows much more volatility in the daily change and a significant reduction in the correlation between yield change across maturity. This volatility comes down in the third period and the correlation improves, probably as an outcome of RBIs repeated exhortations and possibly actions in the bond market. The last period shows further reduction in volatility but the correlation is still lower than in the first period indicating that RBIs notices to the bond market and actions have had some success.
In order to more concretely understand the volatility and correlations across these periods, next two charts present the mean daily change in yields and the volatility of the daily change measured as the standard deviation of the daily change in yield.

Source: Bloomberg, author’s analysis
This chart clearly describes the interest rate trends in these four periods. The first period had, by and large, stable yield curve with very small changes in yields. The second period shows a secular decline in interest rates across all maturities in response to policy rate changes. The third period shows a reversal of trends and modest rise of interest rates ie the upward movement of the yield curve which becomes much more pronounced and sharper in the fourth period.

Source: Bloomberg, author’s analysis
This chart shows that the volatility of yield changes has indeed gone up noticeably in the third period when the overall rates showed an increase. The volatility increased especially for the shorter maturity papers – 1 year and 3-year maturity. This probably is the basis of the RBIs focus on ‘orderly’ evolution and hints to the bond market of its discomfort with high volatility. The fourth period shows that the elevated volatility has persisted which means that the bond market has responded only modestly to the RBI’s exhortations. Another important feature to note is that the volatility of the 10 year and the 5 year maturity securities has been contained in the third and the fourth period while that of the shorter maturity securities has continued to remain high. This possibly could also be due to RBI’s targeted interventionsh in the bond market to contain the rise and volatility of yields on long term securities.
Finally, I look at the correlations of yield changes across these maturities. Table below presents the correlation matrix of the four periods.


Source: Bloomberg, author’s analysis
The correlation matrix shows high correlations between yield changes in the first period that start going down in the second period and decline precipitously in the third period. While they improve in the fourth period, they are still below the high levels of the first period. Clearly, the yield curve moved more haphazardly in the third period with high volatility and low correlation between yield changes across maturities. The fourth period shows improvement in correlations probably due to RBIs constant notices to the bond market (and its possible interventions in the market), they do not reach the levels of the first halcyon period.
Conclusion:
This data shows that RBI concern on orderly evolution of yield curve is well placed. The data clearly shows that in period 2, as the policy rates came down, the yield curve volatility shot up. It may well be that the RBI’s focus during this time was on keeping the long-term interest rates low to facilitate economic recovery during the pandemic. The bond market, on the other hand, was concerned about the economic impact of the pandemic and resulting tussle between the RBI and bond market participants actions resulted in increased volatility and break down of correlations in yield movements across maturity. RBI became aware of this volatility towards the third quarter of fiscal 2022 and realised that low rates will not be enough for economic recovery and the excess volatility must be curbed. As it started expressing its desire of an orderly evolution (accompanied possibly by market interventions) there was a modest decline in volatility and improvement in correlations. However, the markets are still not anywhere close to the halcyon pre-pandemic period.
Harsh Vardhan is an independent management consultant and researcher based in Mumbai. The author thanks Surbhi Bhatia for research assistance, and Josh Felman and anonymous referees for very useful comments
I got your point on the regulator's concern on evolving the yield curve sans volatility. However I would like similar work on the "disconnect" and its extent in regard to rate of inflation and the real rate of interest in the Indian context
ReplyDelete